Quality Assurance/Quality Control of Fluorescence in Situ Hybridization Tests in Hematologic Malignancies
Zhenya Tang 1, *![]() , Jun Gu 2
, Jun Gu 2![]() , Guilin Tang 1
, Guilin Tang 1![]() , L. Jeffrey Medeiros 1
, L. Jeffrey Medeiros 1![]()
- Department of Hematopathology, The University of Texas MD Anderson Cancer Center, Houston, Texas 77030, USA
- Cytogenetic Technology Program, School of Health Professions, The University of Texas MD Anderson Cancer Center, Houston, Texas 77030, USA
* Correspondence: Zhenya Tang![]()
Received: June 22, 2018 | Accepted: September 10, 2018 | Published: October 03, 2018
OBM Genetics 2018, Volume 2, Issue 4 doi:10.21926/obm.genet.1804038
Academic Editor: Thomas Liehr
Special Issue: Applications of Fluorescence in Situ Hybridization
Recommended citation: Tang Z, Gu J, Tang G, Medeiros LJ. Quality Assurance/Quality Control of Fluorescence in Situ Hybridization Tests in Hematologic Malignancies. OBM Genetics 2018;2(4):038; doi:10.21926/obm.genet.1804038.
© 2018 by the authors. This is an open access article distributed under the conditions of the Creative Commons by Attribution License, which permits unrestricted use, distribution, and reproduction in any medium or format, provided the original work is correctly cited.
Abstract
Because of its’ simplicity, reliability and cost-effectiveness, fluorescence in situ hybridization (FISH) is a major technology that is widely applied in clinical diagnosis, especially for hematologic malignancies, even in the era of next-generation sequencing (NGS). In the Clinical Cytogenetics Laboratory at MD Anderson Cancer Center, over 15,000 FISH tests are performed each year, including approximately 1,000 BCR-ABL1 and 500 MYC FISH tests, respectively. In this chapter, we introduce the quality assurance/quality control (QA/QC) measurements applied for FISH tests by following the American College of Medical Genetics and Genomics (ACMGG) technical standards and guidelines. We believe that these measurements are essential for high-quality clinical diagnosis services provided by a clinical laboratory. The BCR-ABL1 FISH test using a commercial fusion probe set on cell suspensions of bone marrow (BM) and peripheral blood (PB) specimen and MYC FISH test using a commercial break-apart probe on paraffin-embedded tissue specimen are shown here as examples. For the use of home-brew FISH probes and FDA-approved FISH test kits, some different QA/QC measurements need be taken and are not included in this chapter.
Keywords
Fluorescence in situ hybridization
Fluorescence in situ hybridization (FISH) is simple, reliable and cost-effective and therefore FISH is a major technology that is widely applied for clinical diagnosis, especially for hematologic malignancies, even in the era of next-generation sequencing (NGS) [1,2,3,4]. In the Clinical Cytogenetics Laboratory at MD Anderson Cancer Center, over 15,000 FISH tests are performed each year, including approximately 1,000 BCR-ABL1 and 500 MYC FISH tests, respectively. In this chapter, we introduce the quality assurance/quality control (QA/QC) parameters applied for FISH tests by following the American College of Medical Genetics and Genomics (ACMGG) technical standards and guidelines [5]. We believe that these measurements are essential for high-quality clinical diagnosis services provided by a clinical laboratory. The BCR-ABL1 FISH test using a commercial fusion probe set on cell suspensions of bone marrow (BM) and peripheral blood (PB) specimens and the MYC FISH test using a commercial break-apart probe on paraffin-embedded tissue specimens are shown here as examples. For the use of home-brew FISH probes and FDA-approved FISH test kits, some different QA/QC measurements need be taken and are not included in this chapter.
As stated in the ACMGG technical standards and guidelines for FISH testing [5], a written policy regarding general QA/QC measurements and quality management (QM) or continuous quality improvement (CQI) system for all FISH tests have been developed in our laboratory and are implemented in our daily work. This policy includes qualification and responsibility of the laboratory director and/or pathologist, manager, supervisor and technologists; standard operating procedure (SOP) manual; monitor and maintenance of all devices and general consuming reagents and other materials; selection of FISH probe from vendors as well as validation of probe with a new lot; inclusion/exclusion criteria for specimens received for testing; frequency of post-analytical review and so on. It is considered as general policy and not discussed in detail here.
Part I: QA/QC Measurement for BCR-ABL1 FISH Testing on BM/PB Specimen
1. Pre-Analytical QA/QC Measurement for BCR-ABL1 FISH Test
1.1 Rationale of Developing BCR-ABL1 FISH Test on BM/PB Specimens
BCR-ABL1 fusion can be both a diagnostic and a prognostic biomarker in several types of leukemia, such as chronic myeloid leukemia (CML), B-cell acute lymphoblastic leukemia (B-ALL) and acute leukemia of ambiguous lineage [6,7,8]. BCR-ABL1 fusion is also an essential biomarker for clinical decisions, including evaluation and monitoring of tyrosine kinase inhibitor (TKI) therapy in these diseases [6,7,8]. There are currently more than 1,000 orders/year for BCR-ABL1 FISH testing on BM and PB specimens in our institution.
1.2 Selection of Commercial BCR-ABL1 FISH Probe
Many vendors offer commercially BCR-ABL1 FISH probes for clinical diagnosis. These probes share the same targets (ABL1 and BCR gene/locus), but they differ in probe length/coverage, hybridization buffer, and probe concentration, signal strength, expenses and so on. Several vendors also provide more than one type of BCR-ABL1 FISH kits with different design: mainly dual-color, single-fusion (SS) probe and dual-color, dual-fusion (DS) probes. The first generation SS probes had a high specificity but a low sensitivity (approximately 5% false positive rate) and are not often used nowadays [9]. According to our policy briefly mentioned above, we have compared 3 probes from at least 2 vendors and we chose the Vysis BCR-ABL1 ES FISH probe (or ES probe. ES means extra signal) based on its performance and capability of distinguishing the major breakpoint (M, p210 BCR-ABL1) and minor breakpoint (m, p190 BCR-ABL1) isoforms. The latter is actually a very important advantage that helps us solve some sophisticated cases in our practice that cannot be solved by chromosomal analysis and/or BM morphology. In general, the Vysis BCR-ABL1 ES FISH probe is considered as a new generation SS probe which overcomes the low sensitivity of the first generation SS probe. Figure 1 includes information of coverage and labeling of 3 types of BCR-ABL1 FISH (DS, SS and ES) probes from Abbott Molecular. Primo et al have described design and coverage of the DS and ES probes in detail. They also listed the common signal patterns for both DS and ES probes in various scenarios. This is a good reference for laboratories using either one of or both the DS and ES probes [9]. We also realize that there are certain limitations of this ES probe in our clinical practice, e.g., requirement of knowledge about the probe design to identify different signal patterns; requirement of metaphase FISH or even map-back FISH (FISH test performed on de-stained G-banded slide) to correlate FISH signals with a karyotype to further characterize the chromosomal changes in some cases; lack of detection of 22q at the 3′ side of BCR gene/locus; and uncertain signals caused by additional chromosomal abnormalities, such as ASS1 gene deletion (see below).
We also use the Vysis BCR/ABL1/ASS1 Tri-Color DF FISH Probe from the same vendor as a reflex test for a few cases with an unusual signal pattern for the ES probe due to deletion of an ASS1 gene or a part of the long arm of the chromosome 9 (9q). This tri-color approach has been validated separately and is not discussed in detail here.
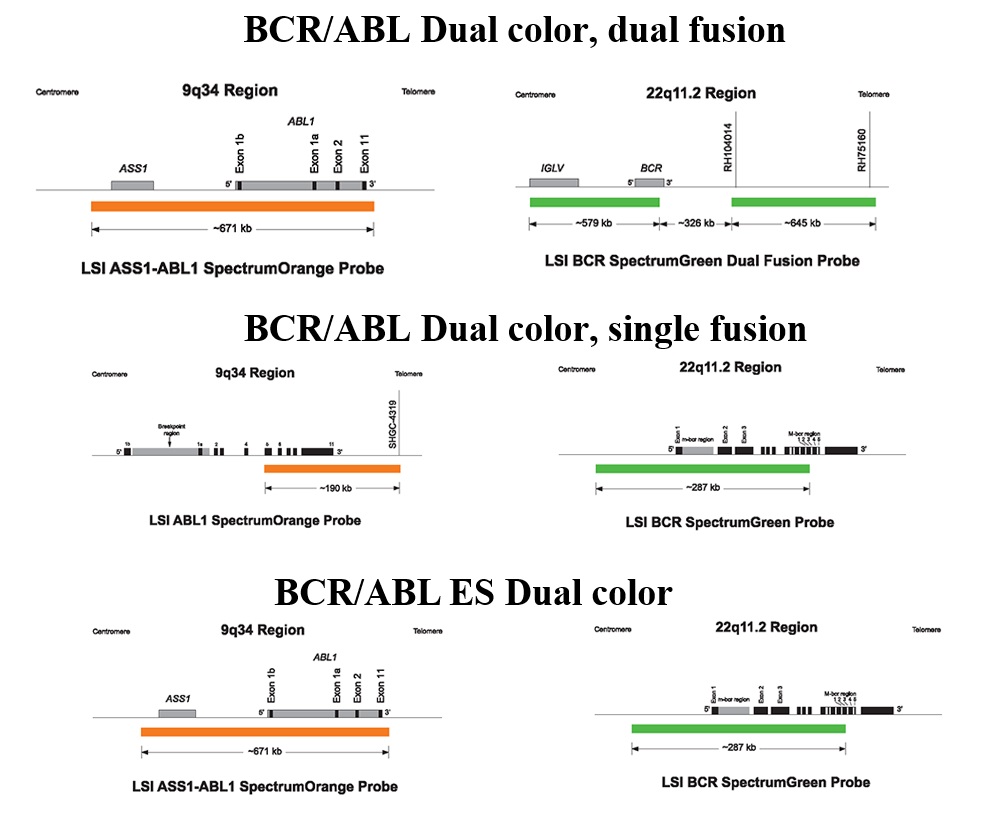
Figure 1 Schematic illustration and coverage in detail of 3 types of BCR-ABL1 probes (DS, SS and ES probes) from Abbott Molecular (with written permission from the vendor)
1.3 Probe Localization, Probe Sensitivity and Probe Specificity
Following ABMGG guidelines [5,10], we perform BCR-ABL1 ES FISH probe localization, sensitivity and specificity with 5 normal male BM samples and at least 20 metaphase cells (4/sample) are analyzed by two technologists in parallel. As shown in Figure 2, the ABL1 probe hybridizes to the band level 9q34 (red signals) and the BCR probe to the band level 22q11.2 (green signals) on the DAPI banding, which have been sequentially confirmed by inverted G-banding (a way to invert the DAPI image to G-banding image of a metaphase) in all cells. Table 1 is used to calculate the probe sensitivity and specificity. For this BCR-ABL1 ES FISH probe tested in our laboratory, both the sensitivity and specificity of the probe are 100%, meeting the criteria stated in the ACMGG guideline E9.3.3 that probe sensitivity of 95% and specificity of 98% should be met or the FISH processes need to be optimized to achieve required percentages [5]. During our practice, we also run BCR-ABL1 FISH on previously G-banded and karyotyped slides to further localize the FISH signals to solve some difficult cases. A separate SOP for this specific procedure, “map-back FISH” or “FISH map-back”, has been developed and several examples are listed in the section of unusual BCR-ABL1 FISH signal patterns below.
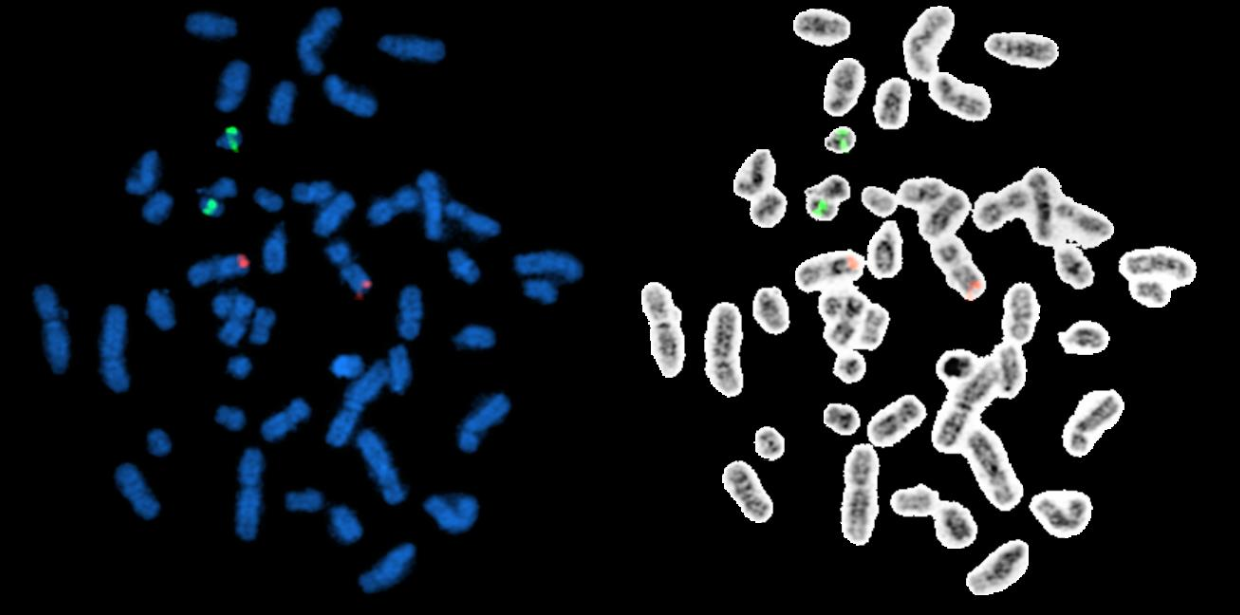
Figure 2 BCR-ABL1 ES FISH probe localization. The ABL1 probe hybridize to the band level 9q34 (red signals) and the BCR probe to the band level 22q11.2 (green signals) on the DAPI banding (metaphases on the left side), which have been sequentially confirmed by inverted G-Banding (metaphases on the right side)
Table 1. Test of BCR-ABL1 ES FISH probe sensitivity and probe specificity
|
Probe name: BCR-ABL1 ES (Abbott Molecular) Lot#: XXXX Sample Type: BM Date: MM/DD/YYYY |
|||||
|
Sample ID |
Tech Initial |
Metaphase cells |
Comments |
||
|
|
|
BCR on 22q11.2 (Green) |
ABL1 on 9q34 (Red) |
Unexpected patterns |
|
|
1 |
AB |
4 |
4 |
0 |
|
|
2 |
CD |
4 |
4 |
0 |
|
|
3 |
EF |
4 |
4 |
0 |
|
|
4 |
GH |
4 |
4 |
0 |
|
|
5 |
AB |
4 |
4 |
0 |
|
|
Total |
|
20 |
20 |
0 |
|
|
|
Probe sensitivity: 100% |
|
|||
|
|
Probe specificity: 100% |
|
|||
1.4 Calculation of Normal Cutoff Values for BCR-ABL1 ES FISH
Twenty normal BM samples that are diploid (46,XX and 46,XY) by conventional cytogenetics and negative for BCR-ABL1 fusion by molecular testing are applied for calculation of normal cutoff values for BCR-ABL1 ES FISH. Two technologists are assigned to analyze each sample in parallel, and each technologist (“reader”) analyzes and documents the reading results of 100 nuclei and 250 nuclei per sample, respectively. It’s required that a difference of reading results for each documented signal pattern is less than 10% between two readers. Otherwise, a third reader is assigned to analyze the sample again. The reading results from two technologists are combined for statistical analysis. We use a binomial method and “mean ± 2SD (at 95% confidence level)” to calculate the cutoff values. Therefore, for each BM/PB FISH test performed in our laboratory, there are two sets of cutoff values obtained for all documented signal patterns, one at 200-cell level and another at 500-cell level. The 200-cell level is considered as a routine analysis, whereas the 500-cell level is applied when an extended analysis is needed. Table 2 is an example of cutoff values for BCR-ABL1 ES FISH at 200-cell level established in our laboratory. Using positive BM samples from patients with CML and B-ALL, we have further confirmed these positive signal patterns for a BCR-ABL1 fusion (2R1G1F; 1R1G2F; 1R1G1F; 2F; 1G2F; 1G1F and 1R1F), while all the other signal patterns included in this table usually indicate a copy number change of ABL1 and/or BCR gene/locus or aneusomy for chromosomes 9 and/or 22 [9].
As mentioned above, one of the major advantages of the Vysis BCR-ABL1 ES FISH probe (or ES probe) is to distinguish the p210 (M) and p190 (m) BCR-ABL1 forms because of the different positive signal patterns. Figure 3 (A and B) includes 2 images representing typical positive signal patterns of 2R1G1F for the p210 form (A) versus 1R1G2F for the p190 form (B) in one metaphase and two interphases, respectively. The p210 form is seen in almost all cases of CML and 10-50% of pediatric and/or adult B-ALL cases, whereas the p190 form is detected only in B-ALL.
The BCR-ABL1 ES FISH validation report is approved and signed by the laboratory director. It must be presented to and approved by an institutional committee for new clinical testing before its implementation for clinical service.
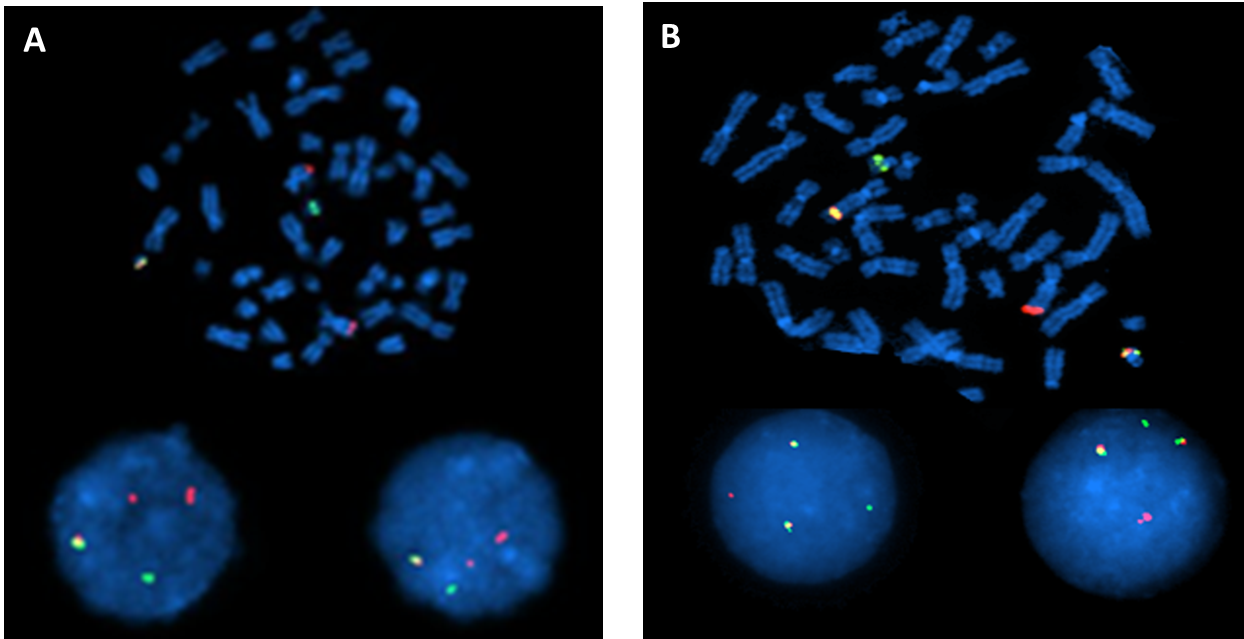
Figure 3 Examples of typical positive signal patterns of 2R1G1F for the p210 form (A) and 1R1G2F for the p190 form (B) observed in both metaphase and interphase cells.
Table 2 Cutoff values established for BCR-ABL1 ES FISH at a 200-cell level

1.5 BCR-ABL1 ES FISH Competency Test for Technologists
Technologists who are assigned to perform the BCR-ABL1 ES FISH test are required to take specific training and pass a competency test, including a written test, hands-on wet lab processing assessment, and signal counting assessment. The written test contains questions about probe design and coverage, test applications, procedures, signal patterns, method of counting, cutoff values, ISCN writing and trouble-shooting. Only qualified and competent technologists are assigned to perform this test on clinical specimen, and their competency testing is repeated annually.
2. Analytical QA/QC Measurement for BCR-ABL1 ES FISH Test
2.1 Error Detection for BCR-ABL1 ES FISH Test
Analytical errors can happen in the areas of test ordering practice, quality control process, and specimen processing. Analytical errors include mistakes in typography, nomenclature (ISCN), abnormality detection and so on. Usually two technologists are assigned to analyze each case (e.g., 100 or 250-cell analysis per technologist per case). At least one supervisor pre-reviews the analysis results and the report draft. The laboratory director performs the final review and approvals the test report. Sometime, the laboratory director may have to hold the report for remaining errors to be solved, in order to repeat the analysis or the whole testing, or even cancel the test.
2.2 Positive and Negative Controls for BCR-ABL1 ES FISH Test
A positive control and a negative control are always included in each batch of BCR-ABL1 ES FISH tests. A positive control can come from CML or ALL patients with known BCR-ABL1 fusion that gives unique signal patterns. Samples with ASS1 gene deletion in addition to BCR-ABL1 fusion (1R1G1F) can also serve that purpose. A positive control confirms that the correct BCR-ABL1 ES probe set is used, while a negative control helps to exclude any cross-hybridization.
2.3 Analyzing and Interpreting BCR-ABL1 ES FISH Test Results
We define the signal patterns for normal cells versus abnormal cells with true fusion signals by BCR-ABL1 ES FISH quantitation. Normal cells have two separate green and two separate red signals and absolutely no fusion signal (2R2G0F). Close red and green signals but not fused (even if the gap between two signals is less than one signal) in a cell are scored as normal. Abnormal cells have one or more yellow fusion signals by truly overlapped (not just very close) red and green signals. Since the lengths of chromosomes are long during the interphase stage, it is very important to recognize the fact that a false fusion signal can result from touching or even twisting together of chromosomes 9 and 22, without actual BCR-ABL1 rearrangement. In a few cases with ABL1 gene amplification (one example is listed below), a false fusion signal has been recorded, but clarified by map-back FISH and PCR.
2.4 Discrepant Reading Results among Technologists
Technologists performing the final analysis are required to follow defined criteria in the SOP manual to select the optimal interphase cells for quantitation. Nuclei that are broken, overlapped, or have significant background are avoided for analysis. Technologists are also required to capture at least one metaphase FISH image to demonstrate the right localization of all probe signals for a BM/PB culture specimen. It can be difficult to capture a metaphase from a BM/PB smear specimen, but a metaphase FISH image from the positive control specimen included in the same batch needs to be included in the report. If one reader has a reading result at or below the cutoff value, but the other reader has it above the cutoff value, a third reader is needed to score 100 nuclei within the hybridization target. Of the three reading results, the two closest to one another are combined to generate the analysis result of 200 nuclei. For any case with an initial analysis result at the cutoff value, both readers increase the number of nuclei assessed for analysis from 100 to 250.
2.5 Unusual Signal Patterns
One of the major challenges for technologists who perform the final analysis of a BCR-ABL1 FISH test is to recognize all possible unusual signal patterns and distinguish them from background noise (especially when the FISH test is performed on BM/PB smear specimen and a low positive rate exists). An unusual signal pattern is defined here as a signal pattern other than the dominant patterns of 2R1G1F for p210 and 1R1G2F for p190, representing likely existence of cells with variant breakpoints and/or BCR-ABL1 fusion through a different mechanism, e.g., insertion [9,11]. Cases with one or more copies of additional Ph+ are relatively commonly observed in our practice, and our technologists are familiar with this phenomenon. However, when a CML case has simultaneous gain of an extra Ph+ and simultaneous deletion of the extra red signal, the signal pattern then cannot be distinguished from the p190 signal pattern. When these unusual signal patterns are unknown previously and/or they present in small percentage of nuclei, they may be challenging to recognize. Nevertheless, they may be relevant clinically and a map-back FISH or other additional FISH tests as well as molecular testing such as PCR can help to verify them. Figures 4, Figures 5, Figures 6, Figures 7, Figures 8 are several examples of BCR-ABL1 positive cases with unusual signal patterns.
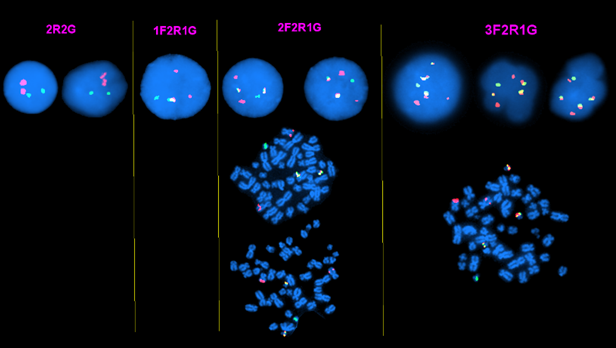
Figure 4 A CML case with 1 to 3 additional Ph+ observed in both metaphase and interphase cells.
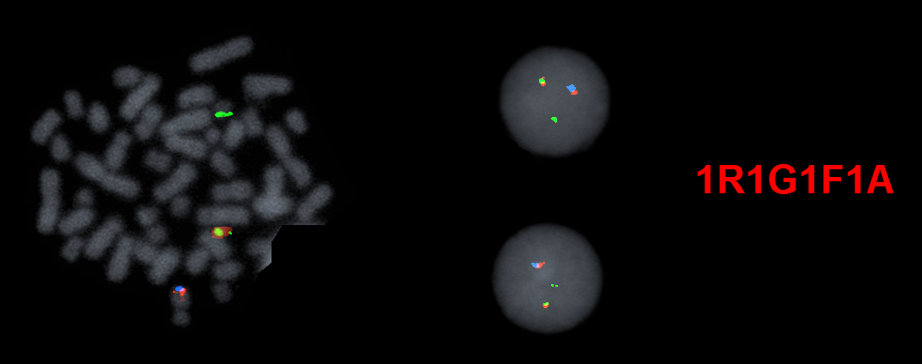
Figure 5 A CML case with an unusual signal pattern of 1R1G1F by BCR-ABL1 ES FISH (image not shown). The BCR/ABL1/ASS1 Tri-Color DF FISH Probe is then applied and further confirms that this is caused by BCR-ABL1 fusion with simultaneous ASS1 gene deletion on the abnormal chromosome 9 (the ASS1 probe also hybridizes to the band level of 9q34 and is labeled with aqua dye).
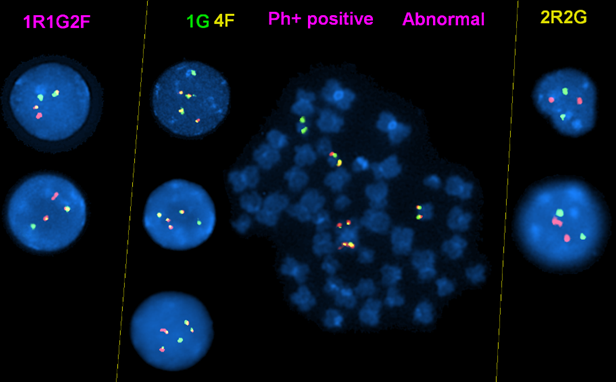
Figure 6 A CML case with a mixture signal patterns (mixture of subclones): the signal pattern of 1R1G2F in this case is caused by simultaneous deletion of ASS1 gene and gain of an extra Ph+. This can be easily confused with the p190 form. The 1G4F signal pattern is caused by existence of two copies of Ph+ and an ider(22)t(9;22) with BCL/ABL1 fusion on both sides as shown on the metaphase image, and loss of both chromosomes 9.
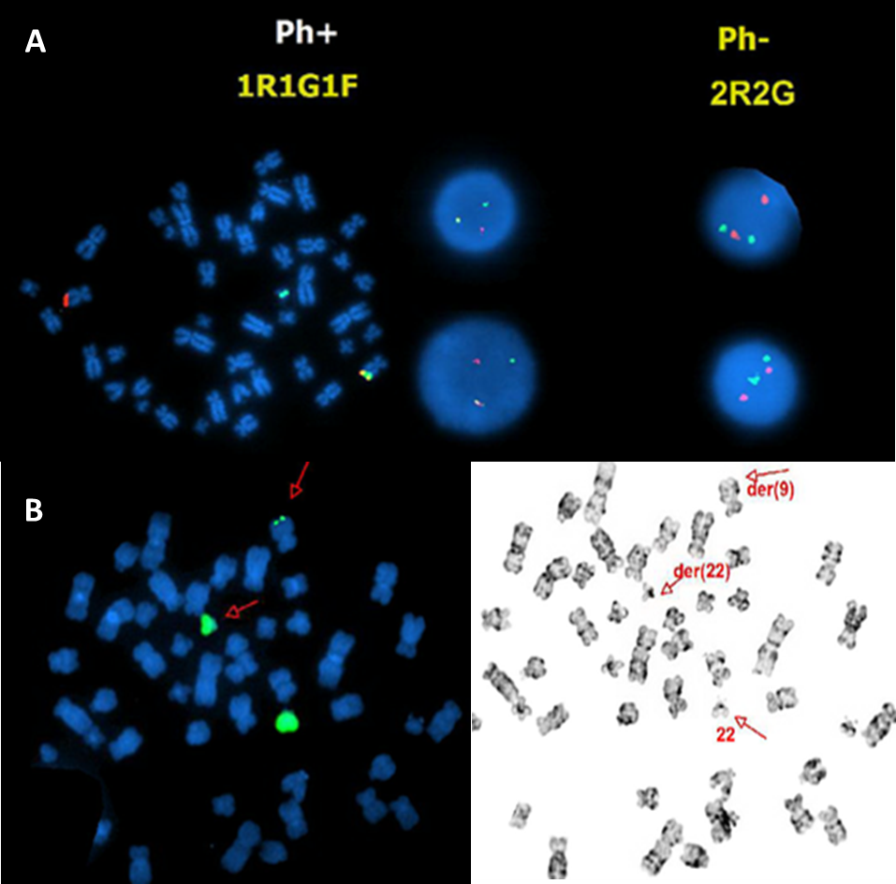
Figure 7 A BCR-ABL1 fusion positive B-ALL case with an unusual signal pattern of 1R1G1F on the interphase FISH images (middle in the top row) and but the fusion signal on the abnormal chromosome 9 on the metaphase FISH image (left in the top row) (A). WPC22 confirms a tiny green signal on the abnormal chromosome 9 (B), indicating that the BCR-ABL1 fusion is caused by insertion of part of the BCR gene into the ABL1 gene in this case.
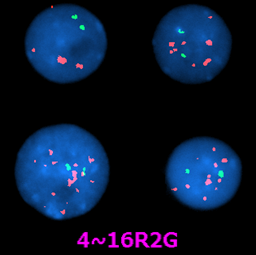
Figure 8 Example of a CML without BCR-ABL1 fusion but with ABL1 gene amplification. It’s sometimes falsely recognized as positive for BCR-ABL1 fusion.
3. Post-Analytical QA/QC Measurement for BCR-ABL1 ES FISH Test
3.1 Policy for Post-Analytical QC Measurement for BCR-ABL1 ES FISH Tests
Errors can be made at any stage of BCR-ABL1 ES FISH testing, including accessioning error, mislabeling, cell culture failure, analysis itself and result reporting. Therefore, we established a procedure for error investigation and correction as part of our QA/QC policy, e.g., at least five cases are randomly selected to be observed and evaluated from start to finish by a laboratory supervisor, manager, or director. If detected, a laboratory supervisor or a senior technologist is assigned to investigate the nature of error and then discuss within a laboratory with the management team including laboratory director(s), pathologist(s), manager(s), and supervisor(s). Corrective action is recommended, approved, and executed as soon as possible to minimize the negative impact on patient care. A laboratory error log is maintained with corrective actions documented. The log is reviewed by the laboratory director monthly. If the corrective action leads to modification of the SOP, technologists are re-trained promptly.
3.2 Proficiency Testing for BCR-ABL1 ES FISH Tests
As stated in our laboratory QA/QC policy, proficiency tests provided by the College of American Pathologists (CAP) for FISH tests are included in our laboratory QM and CQI plan as a mechanism to assure the overall quality of the testing process. All proficiency FISH tests are treated and performed in the same way as are clinical samples collected from patients. We document the receiving, processing, testing, and reporting of results of all proficiency test samples. Corrective actions are required if a proficiency test result is considered unsatisfactory, and all possible causes of an unsatisfactory result are investigated and resolved. The laboratory director reviews and approves the results of all proficiency testing, including investigation of problems or trends, documentation of corrective action, solutions and conclusions. Our laboratory continuously participates the BCR-ABL1 FISH proficiency tests provided by CAP and all results have been satisfactory [12].
3.3 Establishment of a Dynamic Database and Continuous Monitoring of BCR-ABL1 ES FISH Testing
Due to the advances of our laboratory information system (LIS), a dynamic database of all BCR-ABL1 FISH tests that have been performed in our laboratory are electronically stored. It is convenient to use this database in the quality assessment of performance of BCR-ABL1 FISH testing. A summary of BCR-ABL1 ES FISH tests and all other FISH tests is generated and analyzed monthly and annually. With this database, a summary of FISH results of the same patient over time (e.g., from the initial FISH test before treatment until the latest FISH test after treatment) usually can be queried and reviewed graphically. We also periodically compare the results obtained by BCR-ABL1 ES FISH and other methods (e.g., BCR-ABL1 RT-PCR) from the same sample, if available. Any un-reasonable discrepancy between results obtained by two methods is investigated.
3.4 Validation of a New Probe Lot for BCR-ABL1 ES FISH Testing
Any new lots of BCR-ABL1 ES FISH probe are tested and compared with the old lot in parallel [5,10]. Signal size, signal intensity and signal patterns of both the new and old lots are documented. Figure 9 is an example of the form used in our laboratory for this purpose. In practice, the newly received BCR-ABL1 ES FISH probe and all other FISH probes used in our laboratory, even if their lot number is not changed, are periodically tested to follow the guidelines listed in this form to guarantee a consistency and quality of service.
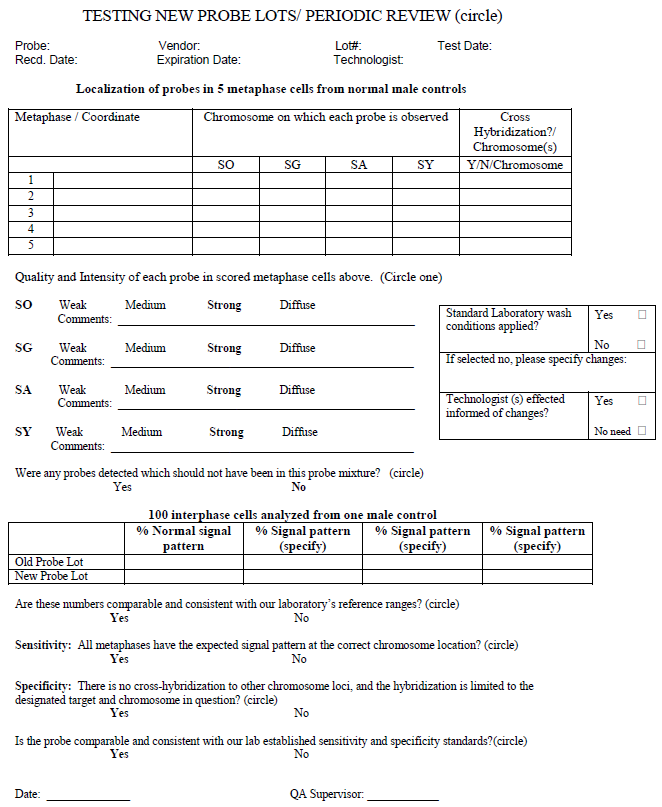
Figure 9 Example of comparison of new and old probe lots/periodic review.
Part II: QA/QC Measurement for MYC Tissue FISH Test
1. Differences between BM/PB and Tissue FISH Tests
FISH testing on formalin fixed paraffin embedded (FFPE) tissue sections is considered a powerful tool for detection of copy number variations (CNVs) (e.g., HER2/neu for breast cancer) and structural aberrations (e.g., ALK rearrangement in lung cancer) of certain genetic biomarkers [1]. This method is also widely used for hematologic malignancies, especially various types of B-cell and/or T- cell lymphoma [2], and a list of tissue FISH tests (e.g., for MYC, BCL2, BCL6, IGH, MALT1 and IRF4 genes) has been developed and adopted in clinical services in our laboratory.
Unlike analysis of cell suspensions, the usual preparation for BM/PB FISH testing mentioned above, tissue FISH testing can be more labor intensive and more challenging for interpretation of results. For tissue FISH, more steps related to specimen treatment are required, including slide aging, wax removal, tissue re-hybridization and so on. Due to differences of fixation methods, lengths of fixation times, thickness and origin of tissue sections among samples and referring laboratories, optimizing each specimen treatment-related step is always a major challenge for the technologists who are performing the testing. For reasons such as blurry boundaries among adjacent cells (sometimes overlapping of two or more cells), truncation of signal(s) caused by tissue sectioning, and availability of interphase nuclei only for analysis, identification and interpretation of the signal pattern(s) can be dramatically limited [13]. Therefore, both technologists and laboratory directors should have a good knowledge of the FISH probe and the anomaly of interest in advance. In the following section, we will use the MYC FISH test as an example to discuss the QA/QC measurements for tissue FISH testing in general.
2. Pre-Analytical QA/QC Measurement for MYC Tissue FISH Test
2.1 Rationale of Developing MYC Tissue FISH Test
MYC, located on the chromosome 8q24.2 locus, is commonly rearranged in clinically aggressive B-cell lymphoma, particularly in virtually 100% of cases of Burkitt lymphoma and high-grade B-cell lymphoma with MYC and BCL2 and/or BCL6 gene rearranged, as well as about 10% of cases of diffuse large B-cell lymphoma [14,15,16,17]. The partner genes of MYC are most often the immunoglobulin genes: IGH gene located at 14q32, IGK located at 2p11, and IGL located at 22q11. MYC also can partner with non-immunoglobulin genes, most often PAX5. MYC tissue FISH testing is therefore essential for patient care with approximately 500 orders/year in our institution.
2.2 Selection of Commercial Probe
A MYC break-apart probe is favored over a fusion probe, e.g. IGH-MYC, mainly due to the ability of a MYC break-apart probe to detect potentially all cases with MYC rearrangement, regardless of the partner gene [18,19]. As mentioned above for the BCR-ABL1 ES FISH probe, currently the Vysis LSI MYC Dual Color Break Apart Probe used in our Clinical Cytogenetics Laboratory is chosen after a parallel comparison with other commercially available MYC probes obtained from different vendors.
2.3 MYC Probe Localization, Sensitivity and Specificity
As soon as the commercial MYC probe is selected, the probe localization, sensitivity and specificity are performed following ACMGG guidelines. Twenty metaphases from 5 normal male BM samples (4 metaphases per sample) are analyzed by two technologists in parallel. All hybridization signals are demonstrated on the band level of 8q24.2 on the inverted G-banding images and no unexpected signal pattern (e.g., cross-hybridization) is observed (Figure 10). Therefore, a probe sensitivity of 100% and specificity of 100% are achieved for the selected MYC probe.
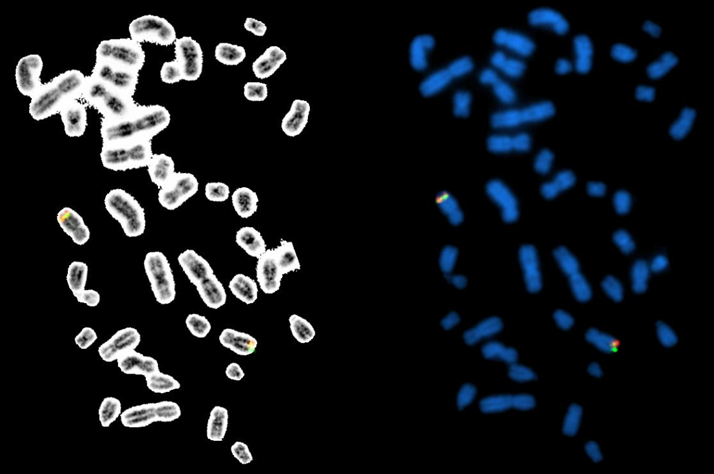
Figure 10 The MYC dual color break apart rearrangement probe localization. The probe hybridize to the band level 8q24.2 (yellow/fusion signals) on the DAPI banding (metaphases on the right side), which have been sequentially confirmed by inverted G-banding (metaphases on the left side).
2.4 Calculation of Normal Cutoff Values for MYC Tissue FISH
Following the ACMGG guidelines for paraffin-embedded FISH analyses, 20 negative FFPE slides selected from our normal tissue bank including a wide spectrum of tissue types are processed under the same optimal conditions. At least 2 technologists are assigned to analyze a total of 200 interphase cells each sample and document all signal patterns. Both mean ± 2SD (at 95% confidence level) and inverse beta functions are applied to establish the cutoff values, but for reporting purpose, the mean ± 2SD interval is used for most cases including the MYC tissue FISH testing in our laboratory [5,20]. The main reason is that a stringent (low) cutoff value is preferred in our institution so that some patients with a low level positivity for a biomarker can be possibly enrolled into clinical trials. Our clinicians are aware of a possible higher false-positive rate by using these cutoff values. Table 3 represents the final reads from each specimen and cutoff values for various signal patterns observed during the validation procedures for MYC tissue FISH in our laboratory. As further confirmed using MYC rearrangement positive samples, the signal patterns of 1R1G1F; 1G2F; 1R1F; 1G 1F; 2R2G and 1R1G are considered as positive signal patterns, whereas the signal patterns of 1F, 3F and 4F mostly indicate aneuploidy cell populations for MYC of unknown clinical significance.
The validation report is approved and is signed by the laboratory director and is presented to and approved by institutional committee for new clinical testing before its implementation for clinical service.
It’s important to point out that almost all probes used for tissue FISH testing (e.g., the MYC probe) are also applied for BM/PB FISH testing in hematologic malignancies in our laboratory, but the validation for BM/PB FISH testing of each probe is separately performed with a different cutoff value for each signal pattern compared with FFPE FISH testing.
Table 3 MYC tissue FISH validation: total reads and cutoff values for various signal patterns observed in 20 negative tissue specimen.
2.5 MYC Tissue FISH Competency Test for Technologists
A written MYC tissue FISH competency test has been developed prior to the clinical utilization of this special test. A technologist has to be trained and pass a competency test including a written test; hands-on processes; analysis of test results, cutoff values, ISCN writing and trouble-shooting, before he or she is assigned to perform this test. The performance of each technologist for this test is always documented and monitored.
3. Analytical QA/QC Measurement for MYC Tissue FISH Testing
3.1 Error Detection
At our hospital, 25 to 35% of all tissue FISH tests are performed on FFPE slides and/or tissue blocks received from other hospitals/clinics for consultation. Due to the complexity of specimen received (various specimen types; different labeling from each hospital/clinic; and different orders, e.g., single test vs. multiple tests on the same requisition form), it’s extremely important to insure that the correct test is performed on each specimen. Therefore, a strict policy for error detection and correction has been established in our laboratory, including but not being limited to, at least two identification numbers (e.g., test# and sample#) with patient’s name on each slide; checks for correct labeling before any treatment is added to the specimen; and at least two technologists assigned to complete the analysis. Other measurements for error detection are the same as that described above for the BCR-ABL1 ES FISH test.
3.2 Positive and Negative Controls
Ideally, test-specific positive and test-specific negative control specimens should be included each time. However, different from BM/PB FISH testing, this QC measurement may not be very practical, especially for laboratories with limited test volumes, mainly due to increased expenses of probe and other reagents; prolonged turnaround time (TAT) while batching the same test orders and even an unavailability of positive control samples. In our laboratory with a relative large volume for each specific test, we also try to batch all the same test orders (e.g., MYC tissue FISH) without jeopardizing the TAT and include test-specific positive and negative controls in the same run. However, we sometimes have to batch different test orders with the same test conditions (e.g., same hybridization temperature; same hybridization length; even same wash conditions) to be included in the same run, and at least one positive control for a specific test (e.g., ALK or HER2/neu controls, mostly) is included for each run. A database of positive and negative controls included in each run is established, and is reviewed by laboratory supervisor to decide which positive and negative controls to be included in the next run of a batch of various test orders.
3.3 Discrepant Reading Results among Technologists
Similar to BCR-ABL1 BM/PB FISH testing, two technologists are primarily assigned to performing the final FISH signal analysis, 100 nuclei per technologist. The technologists are required to make their best judgements by following defined criteria. Once discrepant reading results among these two technologists occur, a third technologist is needed to analyze 100 nuclei as well. For a few cases, even a fourth technologists is required. Two reading results with the closest reading numbers are usually used for the final report. For some sophisticated cases, a laboratory director and/or pathologist is involved in the FISH signal analysis, morphologically identifying scattered target tumor cells by comparing FISH and H&E stained slides.
3.4 Unusual MYC Tissue FISH Signal Patterns
All BM/PB and tissue FISH tests are validated using 20 normal samples and a limited number of positive specimens. A great effort is made to identify and include all possible signal patterns during the validation procedure, however, FISH signal patterns not observed during validation are often detected in clinical cases. A rational interpretation of these findings is very important for clinical management. In these circumstances, a careful literature search and literature review can be very helpful. Two examples of unusual MYC tissue FISH signal patterns are listed below (Figures 11 and Figures 12). Figures 11 represents a case with a mixture of signal patterns, including several positive signal patterns (e.g., 1R1G1F, 1R1F, 1G1F and 1R1G2F) listed in Table 3. Both technologists and the laboratory director should be aware that this can be caused by either complexity of chromosomal abnormalities or overlap and/or truncation of signals. Therefore, in cases like this, a positive result is concluded based on the fact that the reading result of at least one positive signal pattern, but not the sum of two or more positive signal patterns, is above the cutoff value. In a rare situation that the sum of reading results of several positive signal patterns are very high but none of the reading results of each positive signal pattern is above the cutoff value, a third or even a fourth technologist can be assigned to re-analyze the case. Repeating the test with a new slide with further defined areas of interest may solve the puzzle. Figures 12 represents a case with 5’MYC amplification. Different from cases with amplification of intact MYC but no rearrangement, this result is considered as a positive signal pattern for MYC rearrangement, but was not observed during the validation.
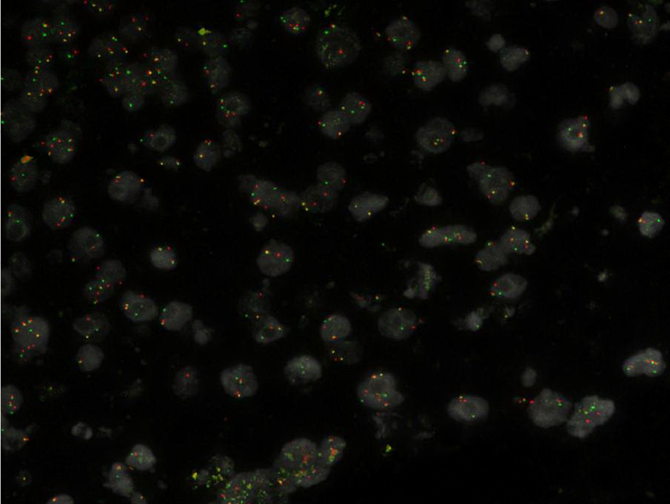
Figure 11 A MYC rearrangement positive case with a mixture of signal patterns, including several positive signal patterns (e.g., 1R1G1F, 1R1F, 1G1F and 1R1G2F).
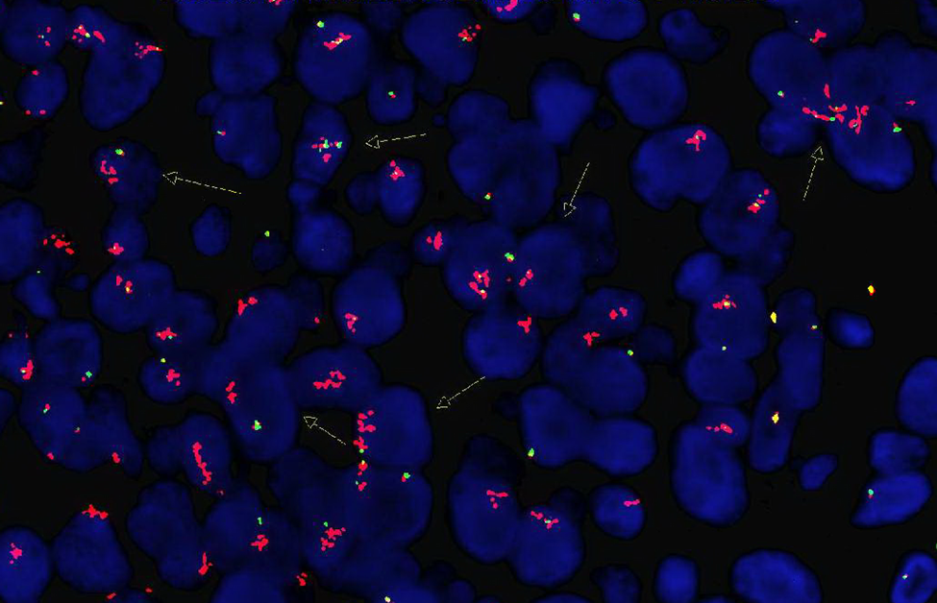
Figure 12 A MYC rearrangement positive case with 5’ MYC amplification.
3.5 Interpreting MYC Tissue FISH Test Results
As same as for all other tissue FISH tests, a “borderline” MYC tissue FISH result is one of the biggest challenges in interpretation. For this matter, a careful correlation with results of other related tests such as immunohistochemistry (IHC), NGS and RNAseq can be very helpful. Other validated and available FISH Probe for MYC rearrangement (e.g., IGH/MYC fusion probe), no matter they are used as a reflex test or not in the laboratory, can be applied to repeat the testing. It has been reported that approximately 5% of MYC rearrangement cases can be detected by IGH/MYC fusion probe but not the MYC break-apart probe [15,18]. Other available methods such as Southern-blot or multiplex PCR can be applied to further clarify the status of MYC rearrangement in the sample. Sometimes, a test fails after repeated attempts of analysis. It is necessary to include the possible reason(s) for the failure of a test, such as unknown type of fixative and aging of paraffin block, in the final report.
4. Post-Analytical QA/QC Measurement for Tissue FISH Tests
4.1 Policy for Post-Analytical QC Measurement and Monitoring all Tissue FISH Test Reports
A written procedure for error investigation and correction has been implemented, and a policy for post-analytical QC measurement has been established and followed in our laboratory for monitoring MYC and all other tissue FISH test performances, including sample mislabeling, failed cases and possible reason(s), typographic errors, addendum/corrected reports and TAT issues. For example, in each month, 5 or more tissue FISH tests which have been reported within the previous month are randomly chosen for post-analytical reviews by the laboratory directors.
4.2 Proficiency Test for Tissue FISH Testing
Our laboratory actively participates in the College of American Pathologists (CAP) proficiency testing (PT) available for all tissue FISH tests including MYC. For the tissue FISH tests without commercial PT available, at least one previously tested positive specimen is used to perform inter-experimental and intra-experimental comparison bi-annually to monitor the performance of our MYC tissue FISH testing.
4.3 Establishment of a Dynamic Database and Continuous Monitoring Tissue FISH Testing
In our laboratory, all procedure steps and important information are captured and stored in our laboratory information system (LIS) in real-time, including but not being limited to specimen accession and labeling, sample treatment and outcomes, sample analysis and results (e.g., reading numbers by each technologist and signal intensity) and final reports. A summary of each type of tissue FISH tests (e.g., MYC) is generated and analyzed both monthly and annually.
In summary, FISH testing plays an important role in the clinical practice of hematologic malignancies. Implementation of QA/QC measurements involving all steps of this test is necessary to guarantee the consistency and quality of this test.
Author Contributions
All authors participated in writing and editing this manuscript.
Competing Interests
The authors have declared that no competing interests exist.
References
- Sugita S, Hasegawa T. Practical use and utility of fluorescence in situ hybridization in the pathological diagnosis of soft tissue and bone tumors. J Orthop Sci. 2017; 22: 601-612. [CrossRef]
- Niu X, Chuang JC, Berry GJ, Wakelee HA. Anaplastic Lymphoma Kinase Testing: IHC vs. FISH vs. NGS. Curr Treat Options Oncol. 2017; 18: 71. [CrossRef]
- Quijada-Alamo M, Hernandez-Sanchez M, Robledo C, Hernandez-Sanchez JM, Benito R, Montano A, et al. Next-generation sequencing and FISH studies reveal the appearance of gene mutations and chromosomal abnormalities in hematopoietic progenitors in chronic lymphocytic leukemia. J Hematol Oncol. 2017; 10: 83. [CrossRef]
- Dubuc AM, Davids MS, Pulluqi M, Pulluqi O, Hoang K, Hernandez-Sanchez JM, et al. FISHing in the dark: How the combination of FISH and conventional karyotyping improves the diagnostic yield in CpG-stimulated chronic lymphocytic leukemia. Am J Hematol. 2016; 91: 978-983. [CrossRef]
- Mascarello JT, Hirsch B, Kearney HM, Ketterling RP, Olson SB, Quigley DI, et al. Section E9 of the American College of Medical Genetics technical standards and guidelines: fluorescence in situ hybridization. Genet Med. 2011; 13: 667-675. [CrossRef]
- Arber DA, Orazi A, Hasserjian R, Thiele J, Borowitz MJ, Le Beau MM, et al. The 2016 revision to the World Health Organization classification of myeloid neoplasms and acute leukemia. Blood. 2016; 127: 2391-2405. [CrossRef]
- Leonard JP, Martin P, Roboz GJ. Practical Implications of the 2016 Revision of the World Health Organization Classification of Lymphoid and Myeloid Neoplasms and Acute Leukemia. J Clin Oncol. 2017; 35: 2708-2715. [CrossRef]
- Wenzinger C, Williams E, Gru AA. Updates in the Pathology of Precursor Lymphoid Neoplasms in the Revised Fourth Edition of the WHO Classification of Tumors of Hematopoietic and Lymphoid Tissues. Curr Hematol Malig Rep. 2018.
- Primo D, Tabernero MD, Rasillo A, Sayagues JM, Espinosa AB, Chillon MC, et al. Patterns of BCR/ABL gene rearrangements by interphase fluorescence in situ hybridization (FISH) in BCR/ABL+ leukemias: incidence and underlying genetic abnormalities. Leukemia. 2003; 17: 1124-1129. [CrossRef]
- Gu J, Smith JL, Dowling PK. Fluorescence In Situ Hybridization Probe Validation for Clinical Use. Methods Mol Biol. 2017; 1541: 101-118. [CrossRef]
- Luatti S, Baldazzi C, Marzocchi G, Ameli G, Bochicchio MT, Soverini S, et al. Cryptic BCR-ABL fusion gene as variant rearrangement in chronic myeloid leukemia: molecular cytogenetic characterization and influence on TKIs therapy. Oncotarget. 2017; 8: 29906-29913. [CrossRef]
- Mascarello JT, Brothman AR, Davison K, Dewald GW, Herrman M, McCandless D, et al. Proficiency testing for laboratories performing fluorescence in situ hybridization with chromosome-specific DNA probes. Arch Pathol Lab Med. 2002; 126: 1458-1462.
- Ventura RA, Martin-Subero JI, Jones M, McParland J, Gesk S, Mason DY, et al. FISH analysis for the detection of lymphoma-associated chromosomal abnormalities in routine paraffin-embedded tissue. J Mol Diagn. 2006; 8: 141-151. [CrossRef]
- Nguyen L, Papenhausen P, Shao H. The Role of c-MYC in B-Cell Lymphomas: Diagnostic and Molecular Aspects. Genes. 2017; 8. [CrossRef]
- Scott DW, King RL, Staiger AM, Ben-Neriah S, Jiang A, Horn H, et al. High-grade B-cell lymphoma with MYC and BCL2 and/or BCL6 rearrangements with diffuse large B-cell lymphoma morphology. Blood. 2018; 131: 2060-2064. [CrossRef]
- Cai Q, Medeiros LJ, Xu X, Young KH. MYC-driven aggressive B-cell lymphomas: biology, entity, differential diagnosis and clinical management. Oncotarget. 2015; 6: 38591-38616. [CrossRef]
- Raess PW, Moore SR, Cascio MJ, Dunlap J, Fan G, Gatter K, et al. MYC immunohistochemical and cytogenetic analysis are required for identification of clinically relevant aggressive B cell lymphoma subtypes. Leuk Lymphoma. 2018; 59: 1391-1398. [CrossRef]
- Munoz-Marmol AM, Sanz C, Tapia G, Marginet R, Ariza A, Mate JL. MYC status determination in aggressive B-cell lymphoma: the impact of FISH probe selection. Histopathology. 2013; 63: 418-424. [CrossRef]
- Liew M, Rowe L, Clement PW, Miles RR, Salama ME. Validation of break-apart and fusion MYC probes using a digital fluorescence in situ hybridization capture and imaging system. J Pathol Inform. 2016; 7: 20. [CrossRef]
- Reddy KS, Tripodi J. Contemplations on preclinical validation of fluorescence in situ hybridization probe assay for paraffin-embedded tissues in hematologic disorders. Cancer Genet Cytogenet. 2008; 183: 1-5. [CrossRef]