

Simultaneous Localization and Mapping (SLAM) for Route Reversal Learning
Kazushige Kimura 1, †, *![]() , James F. Reichert 2, †
, James F. Reichert 2, †![]() , Omid Ranjbar Pouya 1, †
, Omid Ranjbar Pouya 1, †![]() , Ahmad Byagowi 3, †
, Ahmad Byagowi 3, †![]() , Xikui Wang 4, †
, Xikui Wang 4, †![]() , Debbie M. Kelly 2, †
, Debbie M. Kelly 2, †![]() , Zahra Moussavi 1, †
, Zahra Moussavi 1, †![]()
- Graduate Program in Biomedical Engineering, University of Manitoba, 75 Chancellor's Circle, Winnipeg, Canada
- Department of Psychology, University of Manitoba, 190 Dysart Rd, Winnipeg, Canada
- Electrical and Computer Engineering in Faculty of Engineering, University of Manitoba, 75 Chancellor's Circle, Winnipeg, Canada
- Department of Statistics, University of Manitoba, 318 Machray Hall, Winnipeg, Canada
† These authors contributed equally to this work.
* Correspondence: Kazushige Kimura ![]()
Academic Editor: Michael Fossel
Received: May 25, 2018 | Accepted: July 31, 2018 | Published: August 10, 2018
OBM Geriatrics 2018, Volume 2, Issue 3 doi:10.21926/obm.geriatr.1803007
Recommended citation: Kimura K, Reichert JF, Ranjbar Pouya O, Byagowi A, Wang X, Kelly DM, Moussavi Z. Simultaneous Localization and Mapping (SLAM) for Route Reversal Learning. OBM Geriatrics 2018;2(3):007; doi:10.21926/obm.geriatr.1803007.
© 2018 by the authors. This is an open access article distributed under the conditions of the Creative Commons by Attribution License, which permits unrestricted use, distribution, and reproduction in any medium or format, provided the original work is correctly cited.
Abstract
Background: In this paper, we describe the design of a virtual environment (VE) using Simultaneous Localization and Mapping (SLAM) to scan and replicate a real environment (RE) in a virtual domain. Compared to using a CAD software, SLAM allows for the replication of an RE quite easily and quickly. Methods: To test the user’s performance in a SLAM-based VE, we developed an immersive virtual reality setup using a specialized wheelchair (VRNChair) and a head mounted display (Oculus Rift DK2), and employed a knowledge transfer paradigm to investigate navigational performance differences in an RE and its replica in a VE. Our hypothesis was knowledge transfers between the VE and RE would be comparable. Sixteen male students (age of 20.2±2.7 years) learned a route in either an RE or its replica in VE, and then were required to return to the starting point in the counterpart environment. Results: The textures of the environment were substantially degraded in the SLAM-based VE. However, the knowledge transfers between the VE and the RE were not significantly different. Conclusions: Route-based knowledge is transferable between a SLAM-created VE and RE.
Keywords
Virtual Reality; simultaneous localization and mapping; human spatial cognition
1. Introduction
Virtual reality environments (VEs) have been widely used as assessment tools in human navigation studies due to their flexibility, accessibility and controllability compared to real environments (REs) [1,2,3,4,5,6]. To design a virtual model of an RE, typically a Computer-Aided Drawing (CAD) software such as Autodesk 3ds Max is used, and the geometry and texture from the RE is manually programmed to develop a virtual replica [4]. This method is both time and resource consuming; for a sophisticated VE, it may take months of programming. In addition, the design of the virtual replica of an RE will depend on the programmer’s perception of colors, texture and geometry of the environment which is subjective, and may differ among people. During this study, we investigated whether we can use an automated approach, Simultaneous Localization and Mapping (SLAM), to scan an RE and develop an automated VR replica of the RE of the scanned RE.
SLAM has been developed for robot applications such as a rescue victim scenario, in which a robot attempts to find a victim in need of help [7]. During such scenarios, the robot is placed in an unknown environment and required to locate itself within the environment. The orientation and the location of the robot is necessary to form a map of the environment, whereas the map of the environment is necessary to acquire the orientation and location of the robot. To solve this problem, SLAM assesses an environment using sensors to estimate the orientation and location, and forms a map simultaneously [8,9,10]. SLAM requires an appropriate sensor such as a wheel encoder, a laser scanner (LIDAR) and/or a depth camera (such as Kinect), depending on the type of map required for the scenario. For instance, to find an exit within an environment, a robot requires a SLAM that forms a bird’s-eye view map such as Hector SLAM using a 2D laser scanner [11]. To acquire height, however, the robot requires another type of SLAM such as Real-Time Appearance-Based Mapping (RTAB-Map), which uses a Kinect color camera to capture color and a Kinect infrared camera to capture the environment [12]. Kinect captures color using the color camera and depth using the infrared camera simultaneously, and is called a RGB-D camera. RTAB-Map forms a point cloud, which is a set of pixels in a 3D space [12]. This can be con-verted to a textured 3D model, which makes the basis for creating an accurate (geometrically-preserved) replica of the RE. However, to the best of authors’ knowledge, this approach has not been used to replicate an RE for the study of human navigation.
Compared to the conventional approach of using a Computer Aided Design (CAD) software, SLAM has several ad-vantages in the creation of a virtual model. First, SLAM allows for the replication of an RE quite easily and quickly, as SLAM can be performed by walking around the environment using the required equipment; after walking through the environment, the virtual model is ready. A CAD software approach, however, requires the designer to replicate geometry and textures of the environment. Thus, the use of SLAM reduces the time to design a virtual model drastically, and can increase the feasibility of virtual reality for training or research [13,14]. Moreover, SLAM equalizes the quality of virtual models across different environments. The quality of the models depends on the de-signer when one uses CAD software, whereas the quality depends on the equipment when using SLAM.
SLAM has the above-mentioned advantages, but it also has several disadvantages. For example, due to the laser rangefinder employed in most algorithms, one cannot scan transparent materials such as windows. Researchers have tried to overcome this issue by implementing an algorithm to detect reflections from glass [15]. With this approach, the lights emitted from the laser rangefinder should be perpendicular to the surface of the glass, so the laser range-finder detects the reflections. Thus, we cannot apply this approach for general environments in which an obstacle may be placed between the laser rangefinder and the glass, blocking the light traveling to and from the laser rangefinder. In addition, one cannot implement light reflection on glass or mirrored surfaces, whereas doing so using a CAD software is relatively easy [16,17]. A SLAM-developed VE also suffers in terms of texture resolution, because SLAM was initially introduced for robotic applications that do not require photorealistic texture. Also, affordable RGB-D cam-eras such as Kinect, were developed to capture human motion which does not require a high resolution, and thus can degrade the quality of the virtual model. Using a CAD soft-ware approach can resolve these limitations, but with the sacrifice of time needed to create the model.
The above-mentioned limitations of using SLAM for VE development are all due to limitations of existing technologies, which are expected to improve in the near future. Thus, for the first time, we investigated whether a VE developed by SLAM could replace a CAD-designed VE. Thus, for our study, we investigated the feasibility and limitations of such a virtual model. For validation, we employed a knowledge transfer paradigm between an RE and the corresponding VE created using RTAB-Map in conjunction with Hector SLAM. To provide an interactive and an immersive VE environment, we employed a Head Mounted Display (HMD) in conjunction with a specialized wheel-chair (VRNChair) [18]. The HMD, with a head tracking system, provided a wide field of view and allowed for head rotation, while the VRNChair provided body translation and rotation to allow the participants to actively move within the environment.
2. Materials and Methods
2.1 SLAM Algorithms and VE Development
We employed a SLAM platform, called Robot Operating System (ROS) [19] to scan a real environment. ROS is an open-source and tools-based SLAM platform that provides flexibility of the SLAM setup. This flexibility allowed us to use Hector SLAM in conjunction with Real-Time Appearance-Based Mapping (Rtab-MAP) to scan and create a virtual replica of the RE. Initially, we attempted to use wheel encoders and an inertial measurement unit to obtain an odometry, it showed a substantial amount of drift. As Rtab-MAP could not correct the drift during scanning an environment, we decided to use an optical measure with a 2D laser scanner (Hokuyo UTM 30LX). It scans up to 30 meters (accuracy: 0.1 to 10m: ±30mm, 10 to 30m: ±50mm) with an angle of 270 degrees at a frequency of 40 Hz as an input of Hector SLAM; this provided the estimated orientation and the location of the setup, and we used it as odometry. The odometry was then used as an input of Rtab-MAP which combined color images and depth images to form a textured 3D model of the RE. The images were captured using Kinect which scans up to 5 meters with 63 degrees (horizontal, for color image) and 57 degrees (horizontal, for depth image) field of view [20]. The laser scanner and Kinect were rigidly attached, and placed on the tray fixed to the VRNchair. Those instruments were connected to a laptop computer running ROS. Figure 1 depicts the setup for scanning the RE.
The study was approved by the Health Research Ethics Board of University of Manitoba (HS11295 (H2009:033), approved on October 5th, 2016), and the participants signed a consent form prior to their participation.
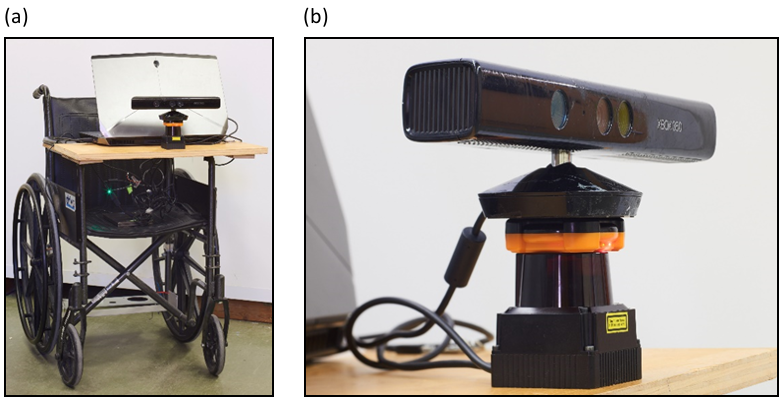
Figure 1 The setup used to scan the real environment. (a) The complete setup. The 2D laser scanner and Kinect camera were connected to a laptop running Robot Operating System on the VRNchair. (b) A closer image of the laser scanner and Kinect camera on the tray of the VRN-chair.
While scanning the RE, Rtab-MAP created a point cloud in a real-time manner. Figure 2 depicts the screenshot of Rtab-MAP.
The virtual replica of the RE was smoothed and resampled in Meshlab [21], converted in Blender and then imported to Unity 4.6 [22], while preserving its scale of being one-to-one.
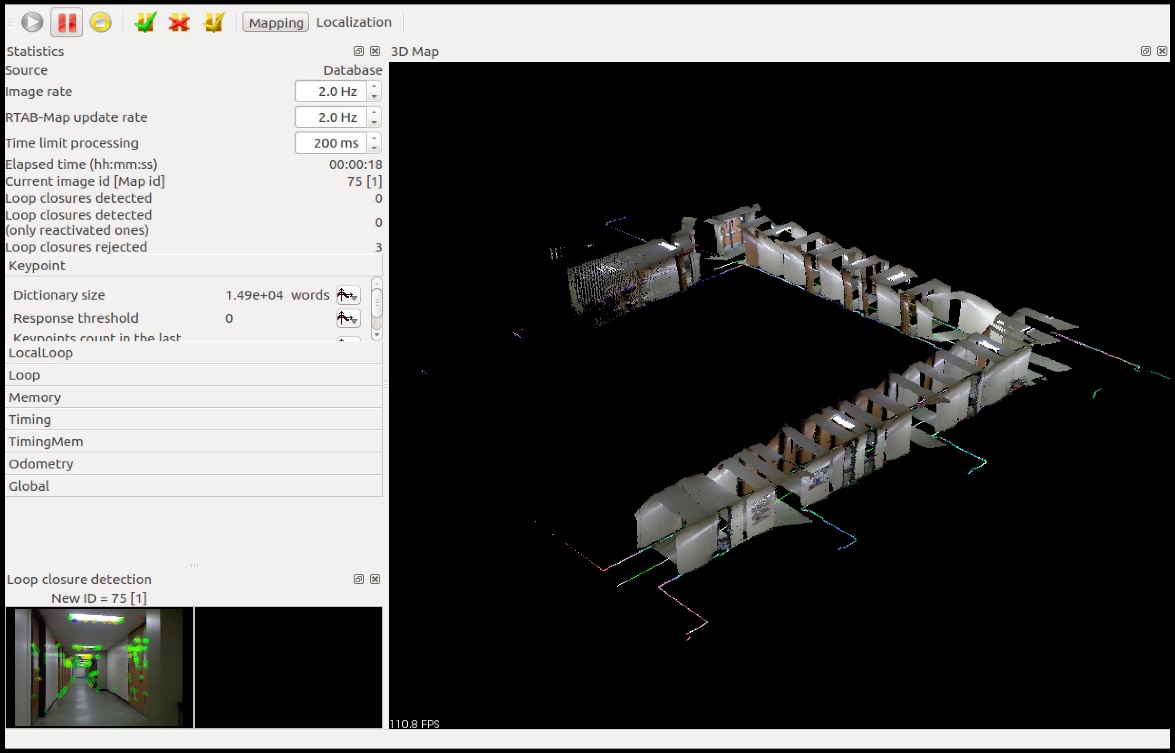
Figure 2 A screenshot of Robot Operating System running Real-Time Appearance-Based Mapping while scanning the real environment. The scanned model is shown on the right.
2.2 Experiment Setup
We developed a custom game engine on Unity 4.6 to allow a person to move throughout the VE. The engine read values from two devices: The VRNChair [18] and an orientation sensor (BNO055). The VRNChair measured the physical motions of forward and backward, whereas the orientation sensor measured the rotation of the VRNChair using an inertial measurement unit mode; those measurements were translated into the virtual domain. The sensitivity of the VRNChair was set to a one-to-one ratio so the movement in the RE was matched to that in the VE, minimizing the risk of kinetosis and keeping the participant’s physical motion in the VE closely comparable to the RE. Additionally, we used a head mounted display (HMD, Oculus Rift DK2, providing 106 degrees of field of view) to allow for head rotation, permitting the participant to change the various angles of the scene shown on the HMD display in real time. The display was divided into a left and right visual field, thus providing parallax changes over the distance between objects in the environment and the user.
2.3 Experiment Design
The experimental design was a 2 × 2 × 2 mixed model, with between-subjects factors of Order of Initial Environment (2 levels: RE and VE) and Initial Route (2 levels: A-B and C-D), and within-subjects factor of Knowledge Transfer (2 levels: RE-VE and VE-RE). To investigate knowledge transfer be-tween the VE and RE, two conditions were designed. During the RE-VE condition, participants were trained in the real environment and subsequently tested in the virtual environment, whereas in the VE-RE participants were trained in the virtual environment and subsequently tested in the real environment. Specifically, during the RE-VE condition, the participants learned to traverse a specific route from an origin location to an end location in the RE, once this initial trial was completed, they were tested for their ability to transfer their knowledge by returning to the origin but now in the virtual environment once. The VE-RE condition was similar, but the participants learned a second different route in the VE and were required to return to the origin in the RE. During all conditions, participants remained in the VRNchair – even during the RE trials but during these trials the participants removed the HMD. – The VRNchair was used to measure traversed distance and trial duration. Figure 3 illustrates these conditions.
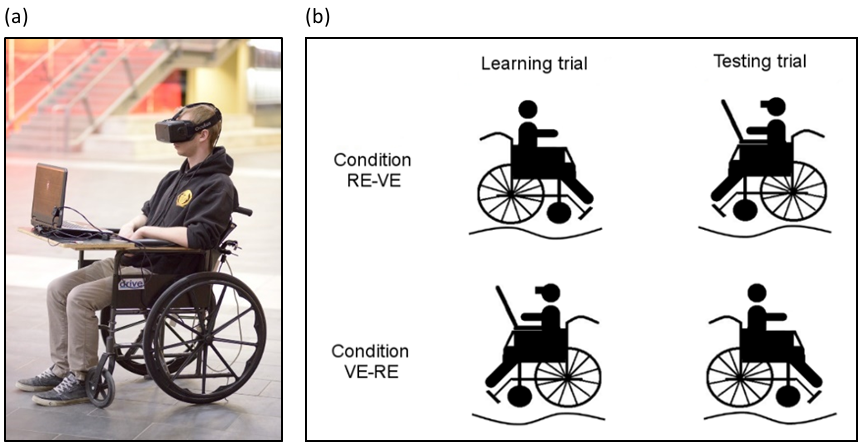
Figure 3 (a) Experimental setup for virtual environment (VE) condition. The participant sat on the wheelchair and looked at the environment through a head mounted dis-play. (b) Conditions employed in this study. During the RE-VE condition, the participants learned the route in real environment (RE), then they were asked to return to the origin in the VE. During the VE-RE condition, the participants learned the route in VE and then were asked to re-turn to the origin in the RE. During the trails in the RE, the participants sat on the wheelchair but did not wear the head mounted display.
Each participant experienced both conditions (RE-VE and VE-RE), but to control for learning, the route they learned in the second condition differed from the first. The two routes differed visually, but were identical in terms of a total distance as well as the number and direction of turns. Figure 4 shows a top-down schematic of the routes: route A-B originates at A and ends at B, whereas route C-D originates at C and ends at D.
Thus, for counter-balancing, the participants were divided into four groups. For the order of the environments, the first and the second groups experienced the VE-RE condition, then experienced RE-VE condition, whereas the third and fourth groups experienced the conditions in the opposite order. For the order of the route, the first and the third groups experienced the route A-B during their first condition, and C-D during their second condition, whereas the second and the fourth groups experienced the routes in the opposite order. The model of the designed experiment is provided in Table 1 for better illustration.
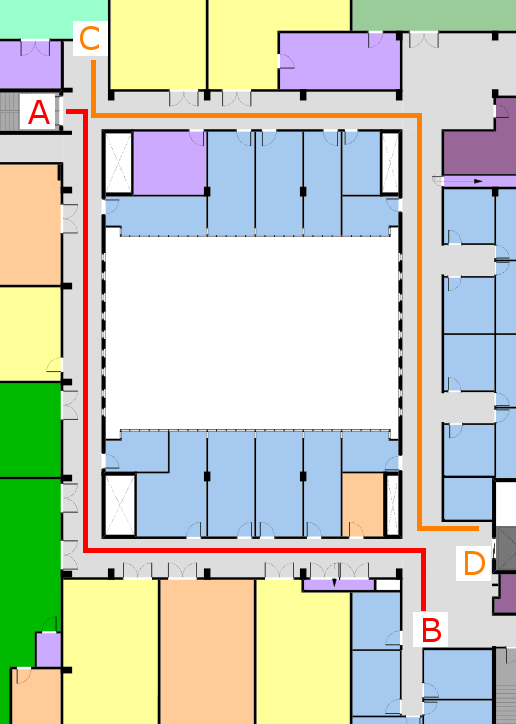
Figure 4 Selected routes for the experiment. The route be-tween A and B (red) and the route between C and D (orange) are of the same distance and number of turns. We counterbalanced the order of the routes across the participants.
Table 1 Experimental groups and routes travelled. Groups 1 and 2 experienced the RE-VE condition in which they learned the route in the real environment (RE) then were subsequently tested in the virtual environment (VE). Groups 3 and 4 experienced those conditions in the opposite order. Groups 1 and 3 experienced route A-B, and then C-D, whereas groups 2 and 4 experienced route C-D, and then A-B.

All of the VE experiments were conducted in the Engineering Atrium located on the main floor of the engineering building which is isolated from the RE to avoid giving the participant any somatosensory cues of the target environment.
2.4 Experiment Procedure
Before starting the experiment, we performed inter-pupillary distance (IPD) calibration, for the HMD, with a tool provided by the manufacturer (Oculus) for each participant. The tool estimates the IPD, which was applied to all of the virtual trials.
Next, participants experienced a practice trial, in which they sat in the VRNChair, wore the HMD and wheeled around a VE that was different from the designed environments for this study; we did not employ SLAM to create this VE. The participant either shuffled their feet on the floor or used their hands on the wheels to move the wheel-chair. This trial allowed the participants to become familiar with the equipment and moving within a VE using the VRNChair.
Following completion of the practice trial, the first learning trial commenced, whereby each participant was verbally guided from the origin to the destination either in the RE or the VE (depending upon the experimental condition). A research assistant (the first author) gave verbal instructions such as “turn left” and “this is the destination” to the participant as he/she traversed the route. After arriving at the destination (end), participants were blind-folded and guided to the corresponding destination in either the VE or the RE, for the completion of the corresponding testing trial. During the testing trial, the assistant did not pro-vide any verbal directions. The trial ended upon the arrival at the origin, or when the participant reported that he/she was lost and could not continue the trial. The trials in the VE took place in the Engineering Atrium and the trials in the RE took place on the 5th floor of engineering building. The separate locations were used to avoid providing the participant with any information (e.g., somatosensory cues) which might be transferred between environments. Next, the participant experienced the second learning trial and corresponding second testing trial. Each learning or testing trial required approximately 5 minutes to complete, and the total duration of the study was approximately 30 minutes.
2.5 Participants
Sixteen male students (20.2±2.7 years) participated in this experiment. All of the participants had normal or corrected-to-normal vision. The participants had no prior familiarity with the layout used in the study. Because of the differences reported between males and females in remembering spatial distances [23] and in the route reversal task [24], for this initial study only adult males were recruited in order to reduce the number of contributing variables.
2.6 Data Analysis
To evaluate ability to complete the two conditions, we used a point system. First, we assigned 0 points for incomplete testing trials and 1 point for completed testing trials for each condition, and subtracted the point of VE-RE condition from that of RE-VE condition for each participant. Then, a Signed Rank Test was used to test the median of the subtracted points to 0, which was expected when we did not have difference between the conditions. As each participant completed one trial in the RE and one trial in the VE, a participant could achieve a score ranging from -1 to +1, if the participant completed only VE-RE condition, or completed only the RE-VE condition, respectively. Participants who did not complete either of the testing trials were excluded from further analysis.
To evaluate the accuracy to follow the learned route, we counted the frequency of erroneous turns for each condition and participant. Then, we subtracted the frequency of the erroneous turns during the testing trials in VE-RE condition from that of RE-VE condition for each participant. A Signed Rank Test was used to test whether the median of the subtracted erroneous turns was 0.
To investigate possible differences in the traversed distances and the duration required to complete the testing trials between the conditions, we employed a Mixed-Model Analysis of Variance (ANOVA) after applying Aligned Rank Transform (ART) to permit the use of non-parametric factorial analysis [25]. As the experimental design was a 2 × 2 × 2 mixed model, each Mixed-Model ANOVA included one within-subjects factor of Knowledge Transfer (2 levels: RE-VE and VE-RE) and two between-subjects factors of Initial Environment (2 levels: RE and VE) and Initial Route (2 levels: A-B and C-D). We selected p < 0.05 as the level of significance unless otherwise mentioned.
3. Results
3.1 Creating a Virtual Replica Using SLAM
Hector SLAM and RTAB-Map provided a virtual replica of the RE with a degraded texture quality. Figure 5 compares the RE and the corresponding VE to illustrate the texture quality of virtual replica. Although the geometry such as width and length of the hallway was preserved overall, the textures of the wall and the objects were substantially degraded.
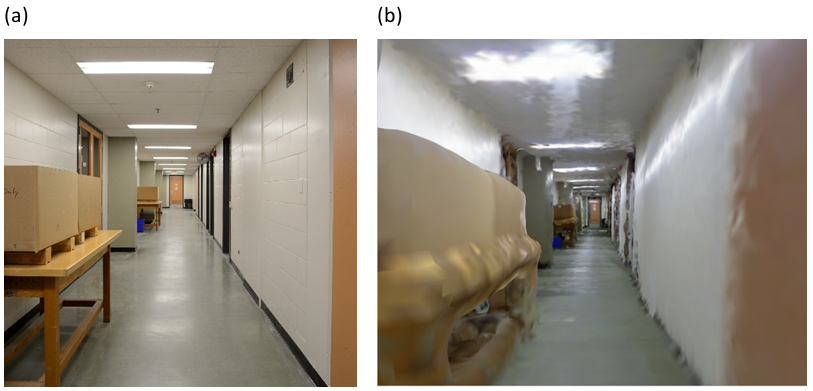
Figure 5 (a) An image of real environment. (b) A screenshot of the virtual replica of the environment shown in (a).
The algorithm of Hector SLAM estimates odometry using a 2D laser scanner. The advantage of Hector algorithm is that it uses a laser scanner that provides less drift compared to mechanical measures such as wheel encoders. The wheel encoders produce a drift over time due to wheel slippage, whereas the laser scanner does not. However, the disadvantage of the algorithm is its failure in estimating odometry when it cannot distinguish features at two positions. An example of such an environment is a long hallway without features, in which the algorithm extracts only two walls regardless of their position. Another example is an environment surrounded by transparent materials such as glass or acrylic walls. In those environments, the laser scanner does not detect the walls as they do not reflect the infrared light emitted by the scanner which can result in the algorithm not being able to adequately account for all obstacles when estimating odometry.
The algorithm of RTAB-Map creates a 3D model with color using the estimated odometry, color images and depth images. The advantage of this algorithm is that it provides a model of the environment in real time unlike Hector SLAM which generates bird’s eye-view map. The disadvantage of the algorithm is texture distortion added to the model, which is due to the depth precision of Kinect (in our setup). As mentioned above, another disadvantage is that it does not scan the transparent materials as the depth images were acquired using infrared light, similar to the laser scanner.
3.2 Navigation Performance
None of the participants reported motion sickness during or after the completion of the experiments. Four of the participants did not complete the testing trials in the condition VE-RE. The number of participants who completed the testing trials and the frequency of the erroneous turns in each condition are summarized in Table 2 and Table 3 respectively.
Table 2 The number of the participants who completed the testing trials in two conditions: the RE-VE condition in which they learned the route in the real environment (RE) then tested in the virtual environment (VE), and the VE-RE condition in which they learned the route in the VE then tested in the RE. Each participant was tested once for each condition.
Table 3 The frequency of the erroneous turns in two conditions: the RE-VE condition in which they learned the route in the real environment (RE) then tested in the virtual environment (VE), and the VE-RE condition in which they learned the route in the VE then tested in the RE. We counted the frequency of the erroneous turns during the testing trials only for the participants who completed both of the conditions.
Next, we excluded the four participants who did not complete either of the testing trials. The traversed distances and time to complete the trials are summarized in Table 4. The participants travelled less distance and spent less time for returning to the origin point in the RE-VE condition.
Table 4 The overall results of the distance travelled and duration to complete the testing trials in the two test conditions (mean ± standard deviation). For the RE-VE condition, the data shown are for the distance travelled and the duration in VE, whereas for the VE-RE condition, the data shown are the distance travelled and time duration in the RE.
The distance travelled and duration to complete the testing trials in the two test conditions (mean ± standard deviation). For the RE-VE condition, the data shown are for the distance travelled and the duration in VE, whereas for the VE-RE condition, the data shown are the distance travelled and time duration in the RE.
Figure 6 shows the distance travelled and the duration to complete the testing trials after applying log transformations. Two participants travelled longer distances and spent longer duration during the testing trials in the RE (i.e., VE-RE condition), compared to the other participants. Including those observations would be inappropriate for a parametric test, and thus we applied Aligned Rank Trans-form (ART) for the distance travelled and the duration for further factorial analysis of our data.
A full factorial Mixed-Model ANOVA on the distance travelled during the testing trials after applying the ART did not reveal any of the significant main effect of Order of Initial Environment (F(1, 16) = 0.08, p = 0.7775), Order of Route (F(1, 16) = 2.83, p = 0.1120) and Knowledge Transfer (F(1, 16) = 3.65, p = 0.0742), and the interactions between Order of Initial Environment × Order of Route (F(1, 16) = 1.75, p = 0.2046), Order of Initial Environment × Knowledge Transfer (F(1, 16) = 0.06, p = 0.8064), Order of Route × Knowledge Transfer (F(1, 16) = 4.45, p = 0.0510) and Order of Initial Environment × Order of Route × Knowledge Transfer (F(1,16) = 1.16, p = 0.2984). These findings are summarized in Table 5.
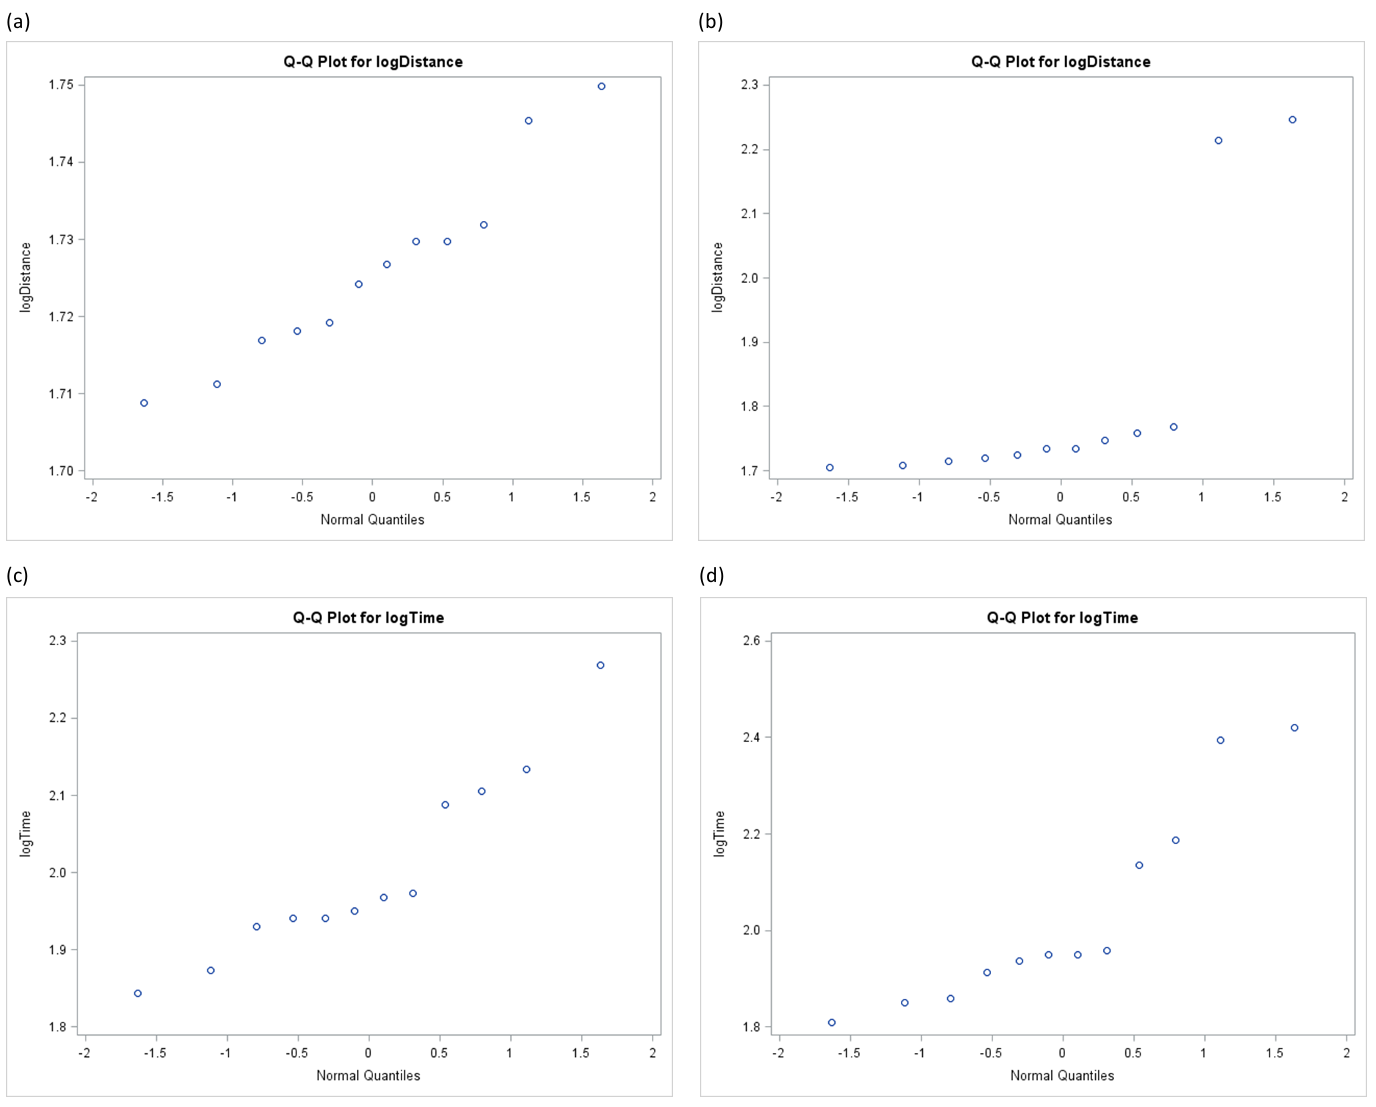
Figure 6 Q-Q plots of the distance travelled and the duration to complete the testing trials after applying log transformations. (a) and (b) show the distance travelled after applying a log transformation during the testing trials in RE-VE condition and in VE-RE condition. (c) and (d) show the duration to complete the testing trials after applying log trans-formations in RE-VE condition and in VE-RE condition. Note the two plots on the right in (b) and (d) that have extreme values compared to the other plots.
Table 5 The results of the full factorial Mixed-Model ANOVA model on the distance travelled during the testing trials after applying the Aligned Rank Transform.
Since our interest was to find significant terms, we removed the insignificant three-way interaction term from the model and employed another Mixed-Model ANOVA which did not show significant interaction between Order of Initial Environment × Order of Route (F(1,17) = 1.76, p = 0.2017) and Order of Initial Environment × Knowledge Transfer (F(1,17) = 0.06, p = 0.8056), but showed significant interaction between Order of Route × Knowledge Transfer (F(1,17) = 4.86, p = 0.0448). Finally, we removed the insignificant two-way interaction terms from the model and employed another Mixed-Model ANOVA which did not show any significant main effects: Order of Initial Environment (F(1, 19) = 0.13, p = 0.7558), Order of Route (F(1,19) = 3.33, p = 0.0839) and Knowledge Transfer (F(1,19) = 4.27, p = 0.0527). The interaction between Order of Route × Knowledge Transfer was significant (F(1,19) = 5.05, p = 0.0366). To examine simple main effect, we divided the data by each Order of Route and employed Sign Test which did not show any significant simple main effect (M = 2.5, p = 0.0625 for the A-B then C-D groups and M = -0.5, p = 1.0 for the C-D then A-B groups). This suggests that the participants who first experienced the route A-B travelled longer in the RE-VE condition and those who first experienced the route C-D travelled longer in the VE-RE condition, but Knowledge Transfer at each level of Order of Route was not significantly different.
A full factorial Mixed-Model ANOVA on the duration to complete the testing trials after applying the ART did not reveal the significant main effect of Order of Initial Environment (F(1, 16) = 0.01, p = 0.9357) and Knowledge Transfer (F(1, 16) = 0.27, p = 0.6096), but revealed the significant main effect of Order of Route (F(1, 16) = 5.49, p = 0.0324). The full factorial Mixed-Model ANOVA revealed the significant interaction between Order of Route × Knowledge Transfer (F(1, 16) = 8.59, p = 0.0098), but not between Order of Initial Environment × Order of Route (F(1, 16) = 4.36, p = 0.0531), Order of Initial Environment × Knowledge Transfer (F(1, 16) = 0.00, p = 0.9862) and Order of Initial Environment × Order of Route × Knowledge Transfer (F(1,16) = 0.15, p = 0.7044). These findings are summarized in Table 6.
Table 6 The results of the full factorial Mixed-Model ANOVA model on the duration to complete the testing trials after applying the Aligned Rank Transform.
Similar to the analysis on the distance travelled during the testing trials, our interest was to find significant terms. Thus, we removed the insignificant three-way interaction term from the model and employed another Mixed-Model ANOVA which did not show significant interaction Order of Initial Environment × Knowledge Transfer (F(1,17) = 0.00 p = 0.9796), but showed significant interaction Order of Initial Environment × Order of Route (F(1,17) = 4.62, p = 0.0462) and Order of Route × Knowledge Transfer (F(1,17) = 9.21, p = 0.0075). Finally, we removed the insignificant two-way interaction term from the model and employed another Mixed-Model ANOVA which did not show significant main effect Order of Initial Environment (F(1,18) = 0.01, p = 0.9318) and Knowledge Transfer (F(1,18) = 0.33, p = 0.5709), but showed significant main effect Order of Route (F(1,18) = 6.07, p = 0.0241). The interaction Order of Initial Environment × Order of Route (F(1,18) = 4.90, p = 0.0401) and Order of Route × Knowledge Transfer (F(1,18) = 9.94, p = 0.0055) were significant. To examine simple main effect of Order of Initial Environment × Order of Route, we divided the data by each Order of Route and employed Exact Wilcoxon Two-Sample Test which did not show any significant simple main effect (Statistic =29.0, two-sided p = 0.1714 for the A-B then C-D groups, and Statistic = 52.0, two-sided p = 0.4136 for the C-D then A-B groups). This suggests the participants who first experienced the route A-B with the RE-VE condition spent longer duration than with the VE-RE condition and those who first experienced the route C-D with the VE-RE condition spent longer duration than with the RE-VE condition, but the difference at each level of Order of Route was not significant. Lastly, to examine simple main effect of Order of Route × Knowledge Transfer, we divided the data by each Order of Route and employed Sign Test which did not show any significant simple main effect (M = 0.5, p = 1.0 for the A-B then C-D groups and M = -2.5, p = 0.1250 for the C-D then A-B groups). This suggests the participants who first experienced the route A-B spent longer duration in the RE-VE condition than that in the VE-RE condition and those who first experienced the route C-D spent longer duration in the VE-RE condition than that in the RE-VE condition, Knowledge Transfer at each level of Order of Route was not significantly different.
4. Discussion
The virtual replica developed using SLAM showed substantial textural distortions. SLAM algorithms including the employed algorithms in this study, were developed for robotic applications that do not require fine detail of the texture in environment. Also, Kinect was developed to capture human motion which does not require a high resolution, while our design requires higher resolution that Kinect captures to replicate the environment with less distortion. Kinect scans up to 5 meters with some error [20], which results in the textural distortion in our model. For example, in Figure 5, the virtual replica showed a vague boundary between the white and the orange part on the right side. The replica also failed to show the khaki boxes on the table on the left side. These visual artifacts were due to the lower resolution of Kinect. To overcome this limitation, our recommendation is to replace Kinect with another device such as a 3D scanner with a higher resolution and a better precision [26]. However, to date, such a scanner is expensive; moreover, its computational overhead might not allow for performing SLAM in real-time.
The number of participants who completed the testing trials was more in the RE-VE condition, in which the testing trials occurred in the virtual environment (VE) following to the training trials in the real environment (RE), than the VE-RE condition. This suggests the knowledge transfer from the RE to the VE was better than that from the VE to the RE. Congruent with the other studies in the field [5,6], the participants learned the route better in the RE com-pared to the VE, although the numbers were not significantly different between the conditions. The analysis of the erroneous turns supports better knowledge transfer from the RE to the VE as well. Spatial knowledge acquisition in the RE may differ from that in the VE; this may explain the difference of the knowledge transfer [27]. To show such results with statistical rigor, a larger data sample is needed.
The results of the traversed distance suggest that, although the main effects were not significant, the VE was less effective to learn than the RE, which can likely be attributed to the textural distortion. To our surprise, we observed a statistically significant interaction between the type of environment and the route order. The results suggest the participants traversed longer during the testing trial in the RE only when they experienced the route be-tween C and D then A and B. Perhaps the participants had different learning curves depending on which one of the routes they experienced first. Although the number of the turns and the distance of the routes were matched, the route between C and D required participants to make the second turn at an intersection whereas the other route required them to make the second turn at a corner if they were to replicate the learned routes, which might explain the route order’s effect.
Next, the results of the time to complete the testing trial showed a significant interaction between the route order and the environment. The participants who experienced the route between C and D first spent longer time during the testing trial in the VE than that in RE, whereas the participants who experienced the route between A and B first spent longer time during the testing trial in the RE than that in VE. Depending upon the order of the routes, the participants spent longer time to complete either in VE or RE. Also, the analysis suggests the participants who experienced the testing trial between C and D in the RE spent longer time to complete the trial than those who experienced the same route in the VE. Perhaps with the route between C and D, the training in the VE and testing in the RE was more challenging than the other combination. The main effect of the route order suggests those who experienced the route between A and B first spent longer time to complete the testing trials. Altogether, the findings of the distance and the time suggest the order of the route could play an important role in acquisition of spatial knowledge. However, we did not observe concrete evidence that knowledge transfers between the environments were different.
The results suggest that our model created with SLAM can be successfully used for studies of human spatial cognition when texture distortion is not a concern. The new approach we employed in this study for creating the VE shows promise for human navigation research, as our results support similar performance between the real environment and the virtual replica. Using SLAM for capturing feature and metric information from the RE, and creating its identical (or approximate) virtual replica would reduce time and cost of designing new VEs. However, the added textural distortion might be problematic for some studies [6].
5. Conclusions
Overall, with current technology, we would recommend using SLAM only in creation of a virtual replica of a real environment with less detail of texture.
Author Contributions
K. K. contributed to the design of the experiment, collecting data, and writing manuscript. J. F. R. contributed to the analysis of the data, and writing manuscript. O. R. P. contributed to design of the experiment, and writing manuscript. A. B. contributed to the design of the experiment. X.W. contributed to the analysis of the data. D. M. K. contributed to the analysis of the data, and writing manuscript. Z. M. contributed to the design of the experiment, and writing manuscript.
Funding
This study was supported by Natural Sciences and Engineering Research Council (NSERC) of Canada.
Competing Interests
The authors have declared that no competing interests exist.
References
- Lin C-T, Huang T-Y, Lin W-J, Chang S-Y, Lin Y-H, Ko L-W, et al. Gender differences in way finding in virtual environments with global or local landmarks. J Environ Psychol. 2012; 32: 89-96. [CrossRef]
- White PJ, Moussavi Z. Neurocognitive treatment for a patient with Alzheimer's disease using a virtual reality navigational environment. J Exp Neurosci. 2016; 10: 129-135. [CrossRef]
- Kober SE, Wood G, Hofer D, Kreuzig W, Kiefer M, Neuper C. Virtual reality in neurologic rehabilitation of spatial disorientation. J Neuroeng Rehabil. 2013; 10: 17. [CrossRef]
- Sorita E, N’Kaoua B, Larrue F, Criquillon J, Simion A, Sauzéon H, et al. Do patients with traumatic brain injury learn a route in the same way in real and virtual environments? Disabil Rehabil. 2013; 35: 1371-1379. [CrossRef]
- Wallet G, Sauzéon H, Rodrigues J, N’Kaoua B. Transfer of spatial knowledge from a virtual environment to reality: Impact of route complexity and subject’s strategy on the exploration mode. J. Virtual Real. Broadcast. 2009; 6.
- Péruch P, Belingard L, Thinus-Blanc C. Transfer of spatial knowledge from virtual to real environments. Spatial Cognition II: Springer. 2000; 253-264.
- Akin HL, Ito N, Jacoff A, Kleiner A, Pellenz J, Visser A. Robocup rescue robot and simulation leagues. AI Mag. 2012; 34: 78. [CrossRef]
- Leonard JJ, Durrant-Whyte HF. Simultaneous map building and localization for an autonomous mobile robot. Intelligent Robots and Systems' 91'Intelligence for Mechanical Systems, Proceedings IROS'91 IEEE/RSJ International Workshop on. Ieee. 1991; 1442-1447. [CrossRef]
- Durrant-Whyte H, Bailey T. Simultaneous localization and mapping: part I. IEEE Robot Autom Mag. 2006; 13: 99-110. [CrossRef]
- Bailey T, Durrant-Whyte H. Simultaneous localization and mapping (SLAM): Part II. IEEE Robot Autom Mag. 2006; 13: 108-117. [CrossRef]
- Kohlbrecher S, Von Stryk O, Meyer J, Klingauf U. A flexible and scalable slam system with full 3d motion estimation. Safety, Security, and Rescue Robotics (SSRR), 2011 IEEE International Symposium on. IEEE. 2011; 155-160.
- Labbe M, Michaud F. Online global loop closure detection for large-scale multi-session graph-based SLAM. Intelligent Robots and Systems (IROS 2014), 2014 IEEE/RSJ International Conference on. IEEE. 2014; 2661-2666. [CrossRef]
- Bouwmeester L, van de Wege A, Haaxma R, Snoek JW. Rehabilitation in a complex case of topographical disorientation. Neuropsychol Rehabil. 2015; 25: 1-14. [CrossRef]
- Claessen MH, van der Ham IJ, Jagersma E, Visser-Meily JM. Navigation strategy training using virtual reality in six chronic stroke patients: A novel and explorative approach to the rehabilitation of navigation impairment. Neuropsychol Rehabil. 2016; 26: 822-846. [CrossRef]
- Wang X, Wang J. Detecting glass in simultaneous localisation and mapping. Robot Auton Syst. 2017; 88: 97-103. [CrossRef]
- Koch R, May S, Murmann P, Nüchter A. Identification of transparent and specular reflective material in laser scans to discriminate affected measurements for faultless robotic SLAM. Robot Auton Syst. 2017; 87: 296-312. [CrossRef]
- Pascu N-E, Dobrescu T, Opran C, Enciu G. Realistic scenes in CAD application. Procedia Eng. 2014; 69: 304-309. [CrossRef]
- Byagowi A, Mohaddes D, Moussavi Z. Design and application of a novel virtual reality navigational technology (VRNChair). J Exp Neurosci. 2014; 8: JEN. S13448.
- Quigley M, Conley K, Gerkey B, Faust J, Foote T, Leibs J, et al. ROS: an open-source Robot Operating System. ICRA workshop on open source software; 2009; 3: 5.
- Smisek J, Jancosek M, Pajdla T. 3D with Kinect. Consumer depth cameras for computer vision: Springer. 2013; 3-25. [CrossRef]
- Cignoni P, Callieri M, Corsini M, Dellepiane M, Ganovelli F, Ranzuglia G. Meshlab: an open-source mesh processing tool. Eurographics Italian chapter conference. 2008; 129-136.
- Technologies U. Unity 4.6 - What's new Unity 4.6. https://unity3dcom/unity/whats-new/unity-46. 2014.
- Ruggiero G, Sergi I, Iachini T. Gender differences in remembering and inferring spatial distances. Memory. 2008; 16: 821-835. [CrossRef]
- Liu I, Levy RM, Barton JJ, Iaria G. Age and gender differences in various topographical orientation strategies. Brain Res. 2011; 1410: 112-119. [CrossRef]
- Wobbrock JO, Findlater L, Gergle D, Higgins JJ. The aligned rank transform for nonparametric factorial analyses using only anova procedures. Proceedings of the SIGCHI conference on human factors in computing systems. ACM. 2011; 143-146. [CrossRef]
- Kersten T, Lindstaedt M. Potential of automatic 3D object reconstruction from multiple images for applications in architecture, cultural heritage and archaeology. Int J Archit Herit. 2012; 1: 399-420. [CrossRef]
- Kimura K, Reichert JF, Olson A, Pouya OR, Wang X, Moussavi Z, et al. Orientation in virtual reality does not fully measure up to the real-world. Sci Rep-UK. 2017; 7: 18109. [CrossRef]
