

Effect of Six-Months Supplementation with Cholecalciferol on Glycemic and Blood Pressure Control in Elderly Type 2 Diabetic Patients with Vitamin D Deficiency: A Pilot Study
Marco Barale * ![]() , Ruth Rossetto Giaccherino
, Ruth Rossetto Giaccherino ![]() , Ezio Ghigo
, Ezio Ghigo ![]() , Massimo Procopio
, Massimo Procopio ![]()
- Division of Endocrinology, Diabetology and Metabolic Diseases, Department of General and Specialty Medicine, Molinette Hospital, University of Turin - CsoDogliotti, 14 - 10126 Turin, Italy
* Correspondence: Marco Barale ![]()
Academic Editor: Michael Fossel
Received: October 31, 2018 | Accepted: January 29, 2019 | Published: February 14, 2019
OBM Geriatrics 2019, Volume 3, Issue 1 doi:10.21926/obm.geriatr.1901033
Recommended citation: Barale M, Giaccherino RR, Ghigo E, Procopio M. Effect of Six-Months Supplementation with Cholecalciferol on Glycemic and Blood Pressure Control in Elderly Type 2 Diabetic Patients with Vitamin D Deficiency: A Pilot Study. OBM Geriatrics 2019; 3(1): 033; doi:10.21926/obm.geriatr.1901033.
© 2019 by the authors. This is an open access article distributed under the conditions of the Creative Commons by Attribution License, which permits unrestricted use, distribution, and reproduction in any medium or format, provided the original work is correctly cited.
Abstract
Background: It is well known that hypovitaminosis D has been associated with various cardio-metabolic disorders, though the pathogenetic link, if any, still remains unclear. Our aim was to evaluate in elderly uncontrolled non-insulin-treated type 2 diabetic patients with hypovitaminosis D, whether six-months vitamin D supplementation was able to improve glycemic control, lipid profile and blood pressure levels. Methods: In an open-label pilot study, thirty type 2 diabetic patients (age 71.5 ± 3.2 years, BMI 29.7 ± 3.5 kg/m2) with hypovitaminosis D (25OHvitamin D 22.02 ± 11.31 nmol/l) were randomized to cholecalciferol supplementation (500 UI/kg p. o. weekly, +D) or no intervention (–D) for six months. At baseline, three and six months all patients were evaluated for serum glucose, glycosylated hemoglobin (HbA1c), lipid profile, systolic (SBP) and diastolic (DBP) blood pressure levels, while calcium mineral metabolism parameters were assessed in all patients at baseline and after vitamin D supplementation. Results: Vitamin D supplementation had a beneficial effect on fasting glucose (mean percentage changes ± SD, –11.0% ± 19.1 vs +7.4% ± 19.7, respectively; p<0.04) and SBP levels (–4.7% ± 9.0 vs +2.9% ± 12.1, respectively; p<0.05) and led to favorable but not significant changes in serum HbA1c and DBP levels in +D vs –D patients. In the former, fasting glucose (8.15 ± 1.57 vs 9.36 ± 1.83 mmol/l), HBA1c (63.4 ± 11.6 vs 74.8 ± 13.8 mmol/mol), SBP (149.7 ± 16.2 vs 157.5 ± 14.7 mmHg) and DBP (79.1 ± 6.4 vs 83.4 ± 4.4 mmHg) levels improved at six months vs baseline, respectively (p<0.05 for all comparisons). After six-months supplementation, we noticed an inverse relationship of serum 25OHvitamin D levels with HbA1c (R =–0.66, p<0.01). Conclusions: Our data in elderly patients with poor controlled type 2 diabetes mellitus and vitamin D deficiency indicate that an adequate six-months supplementation of cholecalciferol, able to restore normal 25OHvitamin D levels, can significantly improve fasting glucose and SBP levels.
Graphical abstract

Keywords
Vitamin D deficiency; cholecalciferol; type 2 diabetes mellitus; hypertension; dyslipidemia
1. Introduction
It is well known that hypovitaminosis D has been associated with various cardio-metabolic disorders, though the pathogenetic link, if any, still remains unclear. Many pre-clinical and animal studies have demonstrated that various tissues involved in the regulation of glucose and lipid metabolism, as well as in blood pressure control, possess specific vitamin D receptors and enzymes able to locally synthesize calcitriol, accounting for paracrine effects of vitamin D on these systemic functions and the association between hypovitaminosis D and cardio-metabolic alterations [1].
Accordingly, many epidemiological studies have shown a correlation between low serum 25OHvitamin D (25OHD) levels and increased prevalence of type 2 diabetes mellitus (T2DM), hypertension, dyslipidemia and metabolic syndrome [2]. Moreover, in T2DM lower serum 25OHD levels and increased frequency of hypovitaminosis D have been reported [3,4] and some data show an association of vitamin D deficiency with enhanced cardiovascular mortality [5]. However, randomized-controlled trials, systematic reviews and meta-analysis have reported inconsistent results on beneficial effects of vitamin D supplementation on cardio-metabolic outcomes. This is probably due to a wide heterogeneity of studied patients’ characteristics (i.e. age, body weight, metabolic and blood pressure control, vitamin D status) and vitamin D supplementation (form, route, dose, frequency and duration of administration) [6,7,8,9].
Thus, the aim of our pilot study was to evaluate in uncontrolled non-insulin-treated type 2 diabetic patients with hypovitaminosis D, whether six-months vitamin D supplementation was able to improve glycemic control, lipid profile and blood pressure levels.
2. Materials and Methods
Among subjects referred consecutively to our Diabetes Care Centre, thirty patients with 1) known T2DM, 2) aged 50-80 years, 3) with BMI 25-39 kg/m2, 4) on treatment with anti-diabetic drugs (sulphonylureas, glinides, metformin, thiazolidinediones, dipeptidyl peptidase-4 inhibitors, glucagon-like peptide 1 receptor agonists, sodium glucose co-transporter 2 inhibitors), 5) with poor glycemic control (HBA1c > 59 mmol/mol) since at least three months before enrollment and 6) hypovitaminosis D (25OHD < 75 nmol/l) were recruited to perform an open-label randomized controlled pilot study. Exclusion criteria included 1) fertile women, 2) patients with metabolic bone diseases (Paget’s disease of bone, primary hyperparathyroidism, idiopathic hypercalciuria), 3) cancer diseases, 4) liver, renal, heart or respiratory failure, 5) intestinal malabsorption and 6) patients on treatment with insulin 7) patients with a recent history of anti-diabetic medication changes during the three months prior to the enrollment 8) patients with drugs known to affect bone mineral metabolism (i.e. barbiturates, corticosteroids, anti-osteoporotic agents, calcium and vitamin D supplements).
This study was performed according to the Declaration of Helsinki II and approved by the local Ethics Committee.
Project identification code: 0050172
Date of approval: 29/04/2013
Name of the ethics committee: Comitato Etico Interaziendale
AOU S. Giovanni Battista di Torino / AO CTO / Maria Adelaide di Torino.
Eligible participants who signed informed consent were assigned into two groups according to a computer-generated random numbers and followed up for six months.
As to administered vitamin D dosage, in order to obtain extra-skeletal effects, we considered a sufficient 25OHD target level of 75-125 nmol/l and an optimal 25OHD target level of 125-175 nmol/l [10,11]. Moreover, we hypothesized the presence of a severe deficiency status in our patients (mean 25OHD levels <25 nmol/l) and we estimated an increase in 25OHD levels of about 2.5 nmol/l for each 100 UI/die (2.5 mcg/die) of given cholecalciferol [12]. Then, we calculated the weekly dosage to administer in a normal-weight patient according to the following formula: [(mean optimal 25OHD levels – mean baseline levels)*100 UI]*7 days/70 kg. The same dosage was maintained for each patient throughout the study.
After randomization, sixteen patients were supplemented with 500 UI / kg oral cholecalciferol once a week, while fourteen patients were observed as control group without intervention for six months. Subjects supplemented returned vitamin D bottles to assess treatment compliance. All patients were not allowed to take other vitamin D supplements.
Anti-diabetic and anti-hypertensive therapy might have been changed in order to improve disease control according to current guidelines.
At baseline, three and six months all patients were evaluated for serum glucose, glycosylated hemoglobin (HbA1c), lipid, SBP, DBP and creatinine levels, while calcium mineral metabolism parameters (both serum and urinary calcium and phosphate, serum PTH, 25OHD, total alkaline phosphatase (ALP) levels) were assessed in all patients at baseline and after six-months vitamin D supplementation.
Moreover, at each participant’s visit, we collected weight and height, we calculated BMI and we measured SBP and DBP. The average of three measurements in a seated position after a 5 minute rest was considered as the final SBP and DBP. Calcium dietary intake was estimated based on a self-reported questionnaire; patients who did not achieve recommended dietary requirements for calcium [13] were treated with oral calcium supplements (500 mg/die of calcium carbonate).
Diagnosis of dyslipidemia and hypertension were based on medical history and according to WHO NCEP ATP III criteria [14] and The Task Force for the Management of Arterial Hypertension of the European Society of Hypertension and the European Society of Cardiology [15], respectively. In line with Endocrine Society Guidelines, vitamin D insufficiency, deficiency and severe deficiency were defined as serum 25OHD between 50 and 74, between 25 and 49 and below 25 nmol/l, respectively [16].
Plasma glucose (mmol/l), serum total (mmol/l) and HDL cholesterol (mmol/l), triglycerides (mmol/l) and creatinine (µmol/l) levels were measured by enzymatic colorimetric tests (Cobas, Roche). LDL cholesterol was calculated using Friedewald’s formula. HbA1c levels were measured through high performance liquid chromatography (HPLC). Glomerular filtration rate (GFR) was calculated according to Cockroft-Gault formula.
Serum and urinary calcium and phosphate (mmol/l and mmol/die) were tested using automated methods based on colorimetric and enzymatic assays (Cobas, Roche). Serum intact parathormone (PTH) assay (pmol/l) based on an immunoradiometric sandwich method (IRMA) that used two polyclonal antibodies (DiaSorin): an antibody recognizing the C-terminal region (aa 39–84) was used as the capture antibody while an antibody recognizing the N-terminal region was used for detection; inter- and intra-assay coefficient of variation were 5.5% and below 3%, respectively. Serum 25OHD (nmol/l) was tested by a radioimmunoassay method using an antibody with specificity to 25OHD (DiaSorin). ALP (UI/l) was tested using colorimetric assay in accordance with a standardized method (Cobas, Roche): in the presence of magnesium and zinc ions, p-nitrophenyl phosphate was cleaved by phosphatases into phosphate and p-nitrophenol, proportional to the ALP activity that was measured photometrically. Serum bone alkaline phosphatase (BAP, µg/l) was measured by an immunoradiometric sandwich method that use mouse monoclonal antibodies directed against two different epitopes of BAP and hence not competing (Beckman Coulter).
Data are presented as mean ± SD or as mean, 95% confidence interval (CI). Normality of frequency distribution functions was tested by the Shapiro–Wilk W-test. Significant differences were sought by the Mann–Whitney U test. Spearman’s R coefficient was used to look for associations of calcium metabolism parameters with glucose, HbA1c, lipid profile and SBP and DBP levels. Calculations were performed using SPSS Windows release 24.0; p < 0.05 was considered significant.
3. Results
3.1 Baseline
Clinical and biochemical features of enrolled patients (21 men and 9 women) both as a whole and separately as a group undergoing either vitamin D (+D) or no vitamin D (−D) supplementation are shown in Table 1 and 2. As reported, at baseline, we have found no differences among the two groups in clinical, anthropometric and biochemical parameters, except for higher serum glucose and lower phosphate levels in patients randomized to +D.
At the time of enrollment, all patients were on anti-diabetic drugs, specifically (frequency, 95% CI): sulphonylureas 63.3%, 46.1-80.6, glinides 16.7%, 3.3-30.0, metformin 83.3%, 70.0-96.7, thiazolidinediones 26.7%, 10.8-42.5, acarbose 6.7%, 0-15.6, dipeptidyl peptidase-4 inhibitors 53.3%, 35.5-71.2, glucagon-like peptide 1 receptor agonists 10%, 0-20.7.
Table 1 Age, BMI, blood pressure levels, parameters of glucose and lipid metabolism and renal function in type 2 diabetic patients both as a whole and separately as a group undergoing either vitamin D (+D) or no vitamin D (–D) supplementation.

Table 2 Parameters of calcium mineral metabolism in type 2 diabetic patients both as a whole and separately as a group undergoing either vitamin D (+D) or no vitamin D (–D) supplementation.
Prevalence of dyslipidemia was 70%, 53.6-86.4 in the whole group. Specifically, hypertriglyceridemia and HDL hypocholesterolemia were found in 33.3%, 16.5-50.2, and 6.7%, 0-15.6, respectively, while LDL (and/or non-HDL) cholesterol target was not achieved by 33.3%, 16.5-50.2. Clinical history of hypertension was present in 56.7%, 38.9-74.4, while increased blood pressure levels were registered in 90%, 79.3-100. Use of anti-dyslipidemic and anti-hypertensive drugs were 53.3%, 35.5-71.2 and 56.7%, 38.9-74.4, respectively. Prevalence of overweight, first and second grade obesity were 66.7%, 49.8-83.5, 20%, 5.7-34.3 and 13.3%, 1.2-25.5, respectively.
Hypovitaminosis D was confirmed in all patients, with prevalence of insufficiency, deficiency and severe deficiency equal to 3.3%, 0-9.8, 30%, 13.6-46.4 and 66.7%, 49.8-83.5, respectively. Consistently, we found increased prevalence of secondary hyperparathyroidism (30%, 13.6-46.4).
No significant differences were registered among +D and −D patients in terms of gender distribution, frequency of metabolic comorbidities and related therapies.
3.2 Calcium and Vitamin D Supplementation
Mean dietary calcium intake was 917 ± 252 mg/die in the whole group, while separately in +D e –D was 950 ± 258 and 879 ± 249 mg/die, respectively (p = NS). The supplementation of 500 mg of calcium carbonate was administered to 8 +D and 9 –D patients.
After randomization, mean vitamin D dosage of supplementation in +D patients was weekly cholecalciferol 39359 ± 5569 UI, with full adherence to therapy in 100% of +D patients.
3.3 Three Months
Clinical and biochemical features of +D and −D patients at three months are shown in Table 3. BMI, blood pressure levels, parameters of glucose and lipid metabolism and renal function were not different among the two groups. However, compared to baseline, +D patients showed a significant reduction in serum glucose (p < 0.006), HbA1c (p < 0.03) and DBP levels (p < 0.007), while creatinine was increased (p < 0.03) despite no significant variations in glomerular filtration rate. On the contrary, we registered no significant variations vs baseline in −D patients, except for increased non HDL cholesterol (p < 0.03).
Table 3 BMI, blood pressure levels, parameters of glucose and lipid metabolismand renal function in type 2 diabetic patients with (+D) and without (–D) vitamin D supplementation at three months.
3.4 Six Months
Table 4 shows clinical and biochemical features at six months in +D and −D patients. As reported, no significant differences were found among the two groups. However, compared to baseline, we confirmed a significant reduction in serum glucose (p < 0.03), HbA1c (p < 0.002) and DBP levels (p < 0.009) in +D patients. Moreover, in the same group, we registered an improvement in SBP values (p < 0.05), while no differences were found in parameters of lipid metabolism, creatinine levels and glomerular filtration rate, compared to baseline. Furthermore, as expected, +D patients showed decreased serum PTH (p < 0.002) and increased 25OHD (p < 0.0001), phosphate (p < 0.002) and urinary calcium excretion (p < 0.004) compared to baseline. Weight-adjusted urinary calcium excretion remained within reference range in all +D patients. Once again, no significant variations were registered in −D patientsvs baseline.
Table 4 BMI, blood pressure levels, parameters of glucose and lipid metabolism, renal function and parameters of calcium mineral metabolism in type 2 diabetic patients with (+D) and without (–D) vitamin D supplementation at six months.
No significant changes were found in +D and −D patients at six vs three months, except for a slight increase in BMI in the latter group (p < 0.04).
Furthermore, as shown in Figure 1 and 2, we found a significant difference in glucose levels (–11.0% ± 19.1 vs +7.4% ± 19.7, respectively; absolute values –1.21 ± 1.87 vs +0.51 ± 1.52 mmol/l, respectively; p < 0.04) and SBP values (–4.7% ± 9.0 vs +2.9% ± 12.1, respectively; absolute values –7.8 ± 14.9 vs +3.6 ± 18.9 mmHg, respectively; p < 0.05) when comparing the mean percentage changes (from baseline to six months) of glucose and blood pressure levels between +D and −D patients. The same analysis did not reveal significant differences in mean percentage changes of HbA1c (–14.2% ± 12.6 vs –5.4% ± 16.3, respectively; absolute values –11.3 ± 11.1 vs –3.6 ± 11.5 mmol/mol, respectively; p = NS), DBP (–5.2% ± 7.0 vs –0.3% ± 11.7, respectively; absolute values –4.4 ± 5.7 vs –1.1 ± 9.8 mmHg, respectively; p = NS) and parameters of lipid metabolism (data not shown) between +D and −D.
Moreover, the changes in anti-diabetic medications throughout the study did not differ among the two groups. Further, we did not register any variation in anti-hypertensive therapy.
Univariate analysis between calcium metabolism parameters and those of either glucose and lipid metabolism or hypertension at six months showed an inverse correlation between 25OHD and HbA1c levels (R -0.66, p < 0.01, Figure 3).
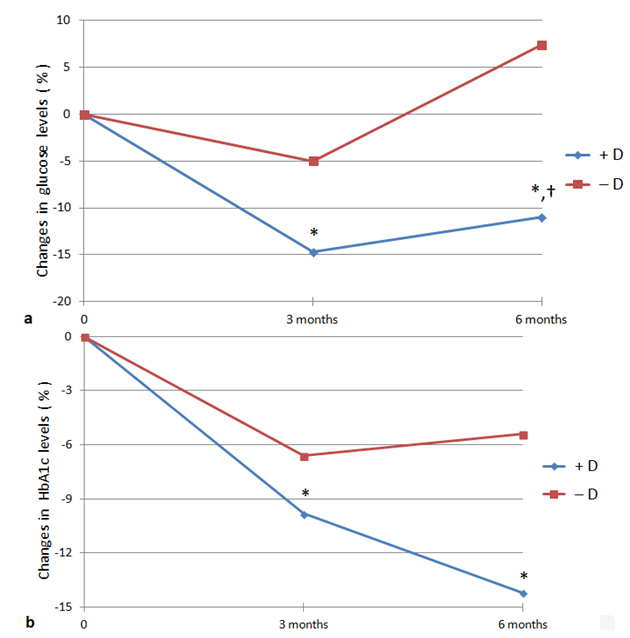
Figure 1 Mean percentage change in glucose (a) and glycosylated hemoglobin. (HbA1c, b) levels in type 2 diabetic patients with (+D) and without (–D) vitamin D supplementation after three and six months.* p < 0.05 vs baseline; † p < 0.04 vs –D.
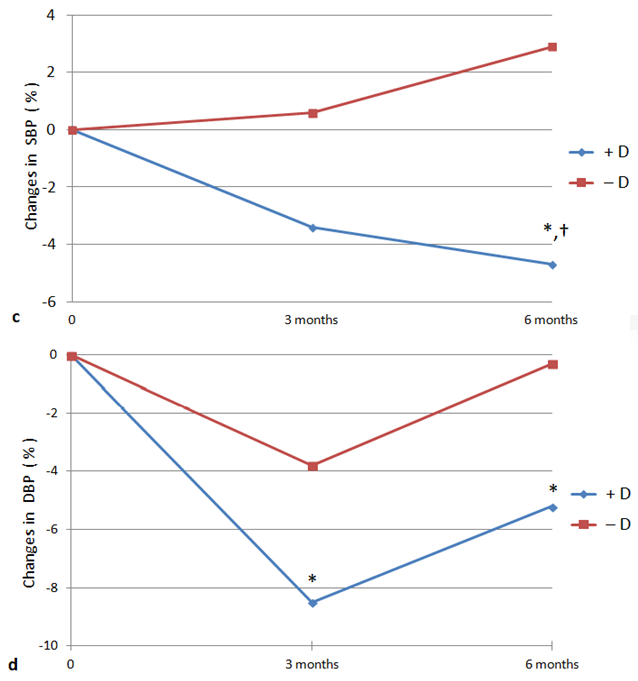
Figure 2 Mean percentage change in systolic (SBP, c) and diastolic blood pressure (DBP, d) levels in type 2 diabetic patients with (+D) and without (–D) vitamin D supplementation after three and six months. *p < 0.05 vs baseline; † p < 0.05 vs –D.
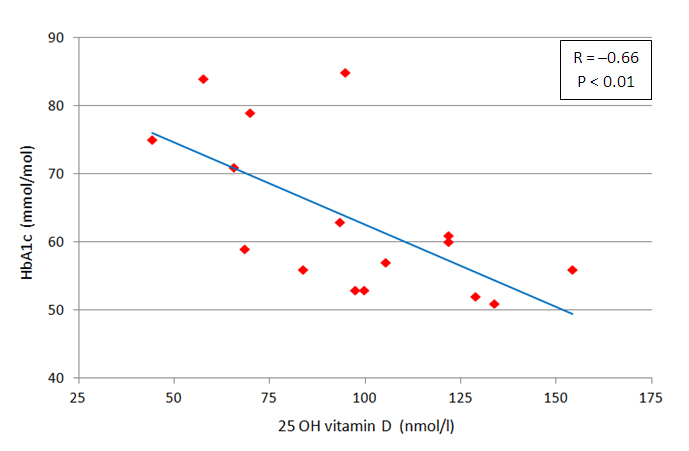
Figure 3 Univariateanalysisbetween 25 OH vitamin D and glycosylated hemoglobin (HbA1c) levels in type 2 diabetic patients on vitamin D supplementation at six months.
4. Discussion
The results of our open-label randomized controlled pilot study in T2DM and severe vitamin D deficiency show that six-months vitamin D supplementation has a beneficial effect on fasting glucose and SBP control, and lead to favorable but not significant changes in serum HbA1c and DBP levels. Moreover, patients supplemented with vitamin D show a significant reduction of fasting glucose, HBA1c, SBP and DBP levels at six months in comparison to baseline. In addition, after six-months supplementation, we noticed an inverse relationship of serum 25OHD levels with HbA1c.
Hypovitaminosis D and cardio-metabolic risk factors such as T2DM, hypertension and dyslipidemia are highly prevalent in aging population. Despite the advances in the management of these chronic disorders, it is still hard to achieve an optimal disease control for many reasons including incorrect lifestyle and low treatment adherence. In this scenario, the opportunity to explore the role of a potential modifiable risk factor for cardio-metabolic alterations such as hypovitaminosis D has attracted the interest of many researchers [1,6]. However, the effect of vitamin D supplementation on cardio-metabolic outcomes still remains a matter of debate. Two main mutually exclusive points of view are now competing in the field to explain this relationship. On one side, some Authors deem that vitamin D is a marker of good health and nutrition so that hypovitaminosis D in patients with cardio-metabolic alterations could be a consequence rather than the cause of these disorders [17]. On the other side, many Authors support a causative role of vitamin D deficiency in the development of hypertension and abnormalities of glucose and lipid metabolism [1,2]. This view bases on plausible biological premise such as the presence of vitamin D receptor and specific enzymes able to locally synthesize active vitamin D in many tissues involved in the regulation of glucose and lipid metabolism as well as in blood pressure control [18]. Accordingly, many epidemiological studies associate low vitamin D levels with a wide range of cardio-metabolic disorders [2,19]. However, specific randomized controlled trials designed to study the effect of vitamin D supplementation on these outcomes have reported inconsistent results [6,7,9,20,21,22]. Nevertheless, it has to be highlighted that many flaws may be identified in these studies, such as a wide heterogeneity of studied patients’ characteristics (i.e. age, body weight, metabolic control, vitamin D status) and vitamin D supplementation (form, route, dose, frequency and duration of administration). In light of these considerations, we decided to perform a well-designed randomized controlled pilot study, specifically focused on type 2 diabetic patients with comorbidity conditions such as hypertension and dyslipidemia, with poor glycemic control and severe vitamin D deficiency, using a dosage of vitamin D carefully weighed to achieve normal 25OHD levels. In doing so, we were able to demonstrate a slight favorable effect of vitamin D supplementation on fasting glucose and SBP levels. Although vitamin D supplementation produces only a slight effect on individual glycemic and blood pressure control in type 2 diabetic patients with hypovitaminosis D, we hypothesize that, from a population perspective, this approach could lead to reduction of cardiovascular morbidity and mortality [23]. Noteworthy, a wider and stronger positive effect of vitamin D supplementation, including also HbA1c and DBP, was noted in +D patients comparing data at six months vs baseline. Though serum 25(OH)D was not re-measured in –D group, it is conceivable to assume that a negligible change could occur without vitamin D supplementation in these elderly patients. However, we cannot exclude a slight improvement of vitamin D status in this group, possibly due to better compliance with lifestyle as a consequence of participation in the study; if this was the case, we speculate that it could have prevented the attainment of a significant difference in changes of HbA1c and diastolic blood pressure levels between +D and –D groups.
In line with our results, a meta-analysis that included longitudinal studies and randomized controlled trials (RCTs) reported a small improvement of fasting glucose and insulin resistance but no beneficial effect of vitamin D supplementation on HbA1c in patients with abnormal glucose tolerance [7]. It has to be noted that these results were obtained despite the studies reported in this meta-analysis were heterogeneous in terms of study subjects, including either those with impaired fasting glucose or impaired glucose tolerance or T2DM, and dose of supplemental vitamin D, duration of follow-up, generally of short-time period, and baseline 25OHD levels, within reference range in half of the studies. Moreover, the number of eligible trials was also small and data on HbA1c, a better marker of glycemic status, were available only from few studies. In addition, a more recent systematic review [8] including prospective studies and randomized controlled trials of short-term duration (< 3 months) showed an improvement of glucometabolic parameters such as HbA1c, HOMA-B (an index of insulin secretion), HOMA-IR and QUICKI (indices of insulin resistance) after vitamin D supplementation in T2DM. Also, in long-term studies (> 3 months) a positive effect of vitamin D supplementation on some glucometabolic outcomes was observed in type 2 diabetic vitamin D deficient patients [8].
On the contrary, the meta-analysis by Seida et al. [9], including studies of vitamin D supplementation in established T2DM, found non-significant improvement of HOMA-IR and HBA1c. Despite exclusion of non-RCT longitudinal studies and studies in which synthetic vitamin D preparations or vitamin D2 were used, it has to be noted that only few studies included in this meta-analysis administered large and prolonged dosages of vitamin D and investigated severe vitamin D deficient patients. In addition, some trials included in this meta-analysis had not studied vitamin D related glycemic outcomes as their primary analysis.
Overall, these systematic reviews and meta-analysis highlight the slight beneficial effect of vitamin D on glycemic outcomes in patients with abnormal glucose tolerance or uncontrolled T2DM with vitamin D deficiency and documented increase in 25OHD levels after supplementation.
Accordingly, vitamin D is able to regulate expression of insulin and insulin receptor genes, as suggested by animal studies showing that calcitriol increases growth and differentiation of pancreatic beta cells and insulin secretion [24]. Moreover, vitamin D deficiency is related to insulin resistance and glucose intolerance [25] through both direct and indirect mechanisms including inflammation, down-regulation of peroxisome proliferator activated receptor–delta, increased activity of renin-angiotensin-aldosterone system (RAAS), due to enhanced expression of renin gene [26].
In addition, our findings show a slight favorable effect of cholecalciferol supplementation on SBP levels, whereas the beneficial effect on DBP does not reach statistical significance. Accordingly, a very recent meta-analysis [6] showed that vitamin D supplementation is able to improve cardiovascular risk factors. Specifically, vitamin D supplementation, with doses above 4,000 IU/d and increased serum 25OHD concentrations ≥ 86 nmol/L decreased SBP and DBP, serum PTH and serum hs-CRP. In particular, the only included study centered on hypertensive patients [27] found a significant reduction in blood pressure following five-months vitamin D supplementation (3,000 IU/day) with improved serum 25OHD levels (50 nmol / L increase) compared to placebo. It has to be noted that the increase in 25OHD levels reached by this study is lesser than ours, according to a lower administered dosage, but, including patients with higher 25OHD baseline levels, lead to higher final values. In line with these results, Tabesh et al. [20], registered a statistically significant reduction of SBP values in vitamin D insufficient type 2 diabetic patients randomized to weekly vitamin D (cholecalciferol 50.000 UI) and daily carbonate calcium (1000 mg) supplements, but also in those who took only vitamin D for eight weeks. Despite a better blood pressure profile (SBP 121-122 mmHg) in comparison with our patients (157.5 mmHg), their higher dosage of cholecalciferol led to a similar absolute decrease in SBP values (approximately 7-8 mmHg). Moreover a similar but not significant effect was found also in terms of reduction of DBP values (4-5 mmHg in both studies). On the contrary, Jorde et al [21] did not reveal a significant effect of high dosage of cholecalciferol (40.000 UI once a week for 6 months) on blood pressure in type 2 diabetic patients. However, it has to be noted that these Authors enrolled patients with vitamin D mild insufficiency (mean 25OHD values equal to 60 nmol/l).
Taken together, the above-mentioned studies show a favorable effect of vitamin D supplementation on blood pressure levels in severe vitamin D deficiency. The biological plausibility of vitamin D involvement in blood pressure control, is supported by the well known effects of vitamin D on endothelial cells and on RAAS activity [26,28].
Further, we do not notice any effect of normalization of vitamin D status on serum lipid levels. In line with a meta-analysis by Wang et al [22], vitamin D seems to exert subtle effects on lipid serum profile. Probably our small sample size did not allow us to reach any statistical significance. However, the above-mentioned meta-analysis by Mirhosseini et al [6] found improved lipid profile (total cholesterol, triglyceride, HDL and LDL) after vitamin D supplementation. It has to be noted that many trials reported in this study included subjects with poor lipid control. On the contrary, our patients showed a good lipid profile at baseline, partly due to a wide use of anti-dyslipidemic drugs, so this could have hampered the effect of vitamin D supplementation on parameters of lipid metabolism. Overall, the few available studies to date do not allow to draw any definite conclusion about the effect of vitamin D supplementation on lipid profile. The potential beneficial effects of vitamin D on lipid metabolism could be due to improvement of insulin secretion and sensitivity with reduced hepatic triglycerides synthesis and high serum HDL-cholesterol levels.
Furthermore, we hypothesize that favorable effect of vitamin D supplementation on cardio-metabolic parameters might be, at least in part, due to PTH levels normalization. In fact, in our sample we register a higher prevalence of secondary hyperparathyroidism corrected by vitamin D supplementation. Many studies suggest that PTH is able to modulate glucose and lipid metabolism as well as blood pressure homeostasis [29,30,31] and this hypothesis has been confirmed in models of chronic hypersecretion of PTH in which an increased prevalence of T2DM and metabolic syndrome have been reported [32].
Strengths of our study are the selection of an homogeneous population of uncontrolled non-insulin treated T2DM patients with comorbidities, such as hypertension and dyslipidemia, and with severe deficient vitamin D status; the randomized controlled study design; the administration of doses of cholecalciferol such as to reach levels of vitamin D sufficiency; control of dietary calcium intake with calcium salts administration whenever indicated; measurement of calcium mineral metabolism parameters including PTH, known to influence glucose and lipid metabolism and blood pressure control.
Our study has several limitations. Firstly the small sample size, consistently with the pilot nature of the study; secondly, the lack of a placebo formulation allowing an adequate concealment to perform a double blind randomized controlled trial; in addition, the short-term period of follow up; finally, the lack of control of the dietary intake of vitamin D and the lack of calcium mineral metabolism parameters in –D patients at six months.
5. Conclusions
Our data in patients with poor controlled T2DM and severe vitamin D deficiency, indicate that six-months supplementation of cholecalciferol, able to restore normal 25OHD levels, improves fasting glucose and SBP values and leads to favorable changes in HbA1c and DBP values. This slight improvement in glycemic and blood pressure control in type 2 diabetic patients could potentially reduce cardiovascular morbidity and mortality. Some long-term RCTs are still in progress in order to clarify the effect of vitamin D supplementation on cardio-metabolic disorder and micro- and macrovascular outcomes with results expected in the next years.
Author Contributions
All the Authors participated in the concept, design, analysis, writing and revision of the manuscript. This material or similar material has not been and will not be submitted to or published in any other publication.
Funding
None
Competing Interests
The authors have declared that no competing interests exist.
References
- Awad AB, Alappat L, Valerio M. Vitamin D and metabolic syndrome risk factors: Evidence and mechanisms. Crit Rev Food SciNutr. 2012; 52: 103-112. [CrossRef]
- Parker J, Hashmi O, Dutton D, Mavrodaris A, Stranges S, Kandala NB, et al. Levels of vitamin D and cardiometabolic disorders: Systematic review and meta-analysis. Maturitas. 2010; 65: 225-236. [CrossRef]
- Isaia G, Giorgino R, Adami S. High prevalence of hypovitaminosis D in female type 2 diabetic population. Diabetes Care. 2001; 24: 1496. [CrossRef]
- Cigolini M, Iagulli MP, Miconi V, Galiotto M, Lombardi S, Targher G. Serum 25-hydroxyvitamin D3 concentrations and prevalence of cardiovascular disease among type 2 diabetic patients. Diabetes Care. 2006; 29: 722-724. [CrossRef]
- Joergensen C, Gall MA, Schmedes A, Tarnow L, Parving HH, Rossing P. Vitamin D levels and mortality in type 2 diabetes. Diabetes Care. 2010; 33: 2238-2243. [CrossRef]
- Mirhosseini N, Rainsbury J, Kimball SM. Vitamin D Supplementation, Serum 25(OH)D concentrations and cardiovascular disease risk factors: A systematic review and meta-analysis. Front Cardiovasc Med. 2018; 5: 87. [CrossRef]
- George PS, Pearson ER, Witham MD. Effect of vitamin D supplementation on glycaemic control and insulin resistance: A systematic review and meta-analysis. Diabet Med. 2012; 29: e142-150. [CrossRef]
- NigilHaroon N, Anton A, John J, Mittal M. Effect of vitamin D supplementation on glycemic control in patients with type 2 diabetes: a systematic review of interventional studies. J Diabetes Metab Disord. 2015; 14: 3. [CrossRef]
- Seida JC, Mitri J, Colmers IN, Majumdar SR, Davidson MB, Edwards AL, et al. Clinical review: Effect of vitamin D3 supplementation on improving glucose homeostasis and preventing diabetes: A systematic review and meta-analysis. J Clin Endocrinol Metab. 2014; 99: 3551-3560. [CrossRef]
- Jorde R, Grimnes G. Vitamin D and health: the need for more randomized controlled trials. J Steroid Biochem Mol Biol. 2015; 148: 269-274. [CrossRef]
- Leu M, Giovannucci E. Vitamin D: epidemiology of cardiovascular risks and events. Best Pract Res Clin Endocrinol Metab. 2011; 25: 633-646. [CrossRef]
- Heaney RP, Davies KM, Chen TC, Holick MF, Barger-Lux MJ.Human serum 25-hydroxycholecalciferol response to extended oral dosing with cholecalciferol. Am J Clin Nutr. 2003; 77: 204-210. [CrossRef]
- Ross AC, Manson JE, Abrams SA, Aloia JF, Brannon PM, Clinton SK, et al. The 2011 report on dietary reference intakes for calcium and vitamin D from the Institute of Medicine: What clinicians need to know. J Clin Endocrinol Metab. 2011; 96: 53-58. [CrossRef]
- National Cholesterol Education Program (NCEP) Expert Panel on Detection, Evaluation, and Treatment of High Blood Cholesterol in Adults (Adult Treatment Panel III).Third report of the National Cholesterol Education Program (NCEP) expert panel on detection, evaluation, and treatment of high blood cholesterol in adults (Adult Treatment Panel III) final report. Circulation. 2002; 106: 3143-3421. [CrossRef]
- ESH/ESC Task Force for the Management of Arterial Hypertension. Practice guidelines for the management of arterial hypertension of the European Society of Hypertension (ESH) and the European Society of Cardiology (ESC). J Hypertens. 2013; 31: 1925-1938.
- Holick MF. Vitamin D deficiency. N Engl J Med. 2007; 357: 266-281. [CrossRef]
- Autier P, Boniol M, Pizot C, Mullie P. Vitamin D status and ill health: A systematic review. Lancet Diabetes Endocrinol. 2014; 2: 76-89. [CrossRef]
- Christakos S, Hewison M, Gardner DG, Wagner CL, Sergeev IN, Rutten E, et al. Vitamin D: Beyond bone. Ann N Y Acad Sci. 2013; 1287: 45-58. [CrossRef]
- Wang TJ. Vitamin D and Cardiovascular Disease. Annu Rev Med. 2016; 67: 261-272. [CrossRef]
- Tabesh M, Azadbakht L, Faghihimani E, Tabesh M, Esmaillzadeh A. Effects of calcium-vitamin D co-supplementation on metabolic profiles in vitamin D insufficient people with type 2 diabetes: a randomised controlled clinical trial. Diabetologia. 2014; 57: 2038-2047. [CrossRef]
- Jorde R, Figenschau Y. Supplementation with cholecalciferol does not improve glycaemic control in diabetic subjects with normal serum 25-hydroxyvitamin D levels. Eur J Nutr. 2009; 48: 349-354. [CrossRef]
- Wang H, Xia N, Yang Y, Peng DQ. Influence of vitamin D supplementation on plasma lipid profiles: a meta-analysis of randomized controlled trials. Lipids Health Dis. 2012; 11: 42. [CrossRef]
- Bjelakovic G, Gluud LL, Nikolova D, Whitfield K, Wetterslev J, Simonetti RG, et al. Vitamin D supplementation for prevention of mortality in adults. Cochrane Database Syst Rev. 2014; 1: CD007470. [CrossRef]
- Mitri J, Pittas AG. Vitamin D and diabetes.Endocrinol Metab Clin North Am. 2014; 43:205-232. [CrossRef]
- Chiu KC, Chu A, Go VL, Saad MF. Hypovitaminosis D is associated with insulin resistance and beta cell dysfunction. Am J Clin Nutr. 2004; 79: 820-825. [CrossRef]
- Harinarayan CV. Vitamin D and diabetes mellitus. Hormones (Athens). 2014; 13: 163-181. [CrossRef]
- Larsen T, Mose FH, Jesper N. Bech JN, Hansen AB, Pedersen EB. Effect of cholecalciferol supplementation during winter months in patients with hypertension: a randomized, placebo-controlled trial. Am J Hypertens. 2012; 25: 1215–1222. [CrossRef]
- Kassi E, Adamopoulos C, Basdra EK, Papavassiliou AG. Role of vitamin D in atherosclerosis. Circulation. 2013; 128: 2517-2531. [CrossRef]
- Fadda GZ, Akmal M, Lipson LG, Massry SG. Direct effect of parathyroid hormone on insulin secretion from pancreatic islets. Am J Physiol. 1990; 258: E975-984.
- Chiu KC, Chuang LM, Lee NP, Ryu JM, McGullam JL, Tsai GP, et al. Insulin sensitivity is inversely correlated with plasma intact parathyroid hormone level. Metabolism. 2000; 49: 1501-1505. [CrossRef]
- Zhang Y, Zhang DZ. Circulating parathyroid hormone and risk of hypertension: A meta-analysis. Clin Chim Acta. 2018; 482: 40-45 [CrossRef]
- Procopio M, Barale M, Bertaina S, Sigrist S, Mazzetti R, Loiacono M, et al. Cardiovascular risk and metabolic syndrome in primary hyperparathyroidism and their correlation to different clinical forms. Endocrine. 2014; 47: 581-589. [CrossRef]
