Correlation of CT and MR Perfusion and Permeability Parameters for Intracranial Tumors
Kirsten Greenlaw 1 ![]() , Jai Jai Shiva Shankar 2, *
, Jai Jai Shiva Shankar 2, * ![]()
![]()
- Department of Diagnostic Imaging, Division of Neuroradiology, Dalhousie University, Halifax, Canada
- Department of Radiology, University of Manitoba, Winnipeg, Canada
* Correspondence: Jai Jai Shiva Shankar ![]()
![]()
Received: October 7, 2018 | Accepted: January 4, 2019 | Published: January 14, 2019
OBM Neurobiology 2019, Volume 3, Issue 1, doi:10.21926/obm.neurobiol.1901019
Academic Editor: Antonio Meola
Special Issue: Tumors of the Central Nervous System
Recommended citation: Greenlaw K, Shankar JJS. Correlation of CT and MR Perfusion and Permeability Parameters for Intracranial Tumors. OBM Neurobiology 2019; 3(1): 10; doi:10.21926/obm.neurobiol.1901019.
© 2019 by the authors. This is an open access article distributed under the conditions of the Creative Commons by Attribution License, which permits unrestricted use, distribution, and reproduction in any medium or format, provided the original work is correctly cited.
Abstract
Background: Perfusion imaging, mainly MR perfusion (MRP), is performed frequently for brain tumor imaging. CT perfusion (CTP) is less studied as a method for characterizing brain tumors. The purpose of this study was to demonstrate the usefulness of CTP perfusion parameters in evaluating brain tumors and to compare it with MRP measures in the same patient population. Methods: Patients underwent CTP and MRP imaging prospectively. Images were processed with vendor-provided and vendor-neutral software. Four regions of interests were placed in whole tumor, solid portion of the tumor, region of maximum perfusion and contralateral normal white matter. Absolute and normalized values of cerebral blood flow (CBF), cerebral blood volume (CBV), and permeability were obtained for both CTP and MRP and compared using correlation and linear regression. Results: We compared CTP and MRP in 20 patients with intracranial tumors. With vendor-provided software, we found significant correlation for absolute CBV in the region of maximum perfusion (r2 = 0.26, p = 0.031) and for normalized CBV (r2 = 0.29, p = 0.020) and normalized CBF (r2 = 0.34, p = 0.011) in the whole tumor. With vendor-neutral software, we found significant correlation for normalized CBF in whole tumor (r2 = 0.38, p = 0.008) and in solid component (r2 = 0.47, p = 0.002). There were no significant correlations for the permeability parameters.Conclusions: In comparing CTP and MRP methods, several statistically significant positive correlations were seen for CBF and CBV values. CTP may potentially be used interchangeably with MRP, for imaging of brain tumors, especially when MRP is contraindicated.
Keywords
CT perfusion; MR perfusion; intracranial tumours
1. Introduction
Advanced imaging is becoming standard of care for characterization and preoperative planning of brain tumors, predominately with MRI. MR perfusion (MRP) has been shown to be an effective technique for predicting tumor angiogenesis and tumor grade; verifying tumor involvement that may not demonstrate enhancement; and differentiating tumor recurrence from post radiation pseudoprogression [1,2].
Both CTP and MRP use the same basic principles to estimate tissue perfusion; by use of dynamic whole brain imaging during bolus contrast injection. Contrast is used to establish a density change in CTP and T2* shortening in MRP [3]. Cerebral blood volume (CBV) measures the total volume of blood in the intravascular space in a selected region of interest (ROI) and is measured in milliliters of blood per 100 g of brain tissue. Cerebral blood flow (CBF) measures the volume of blood moving through a given volume of 100 g of brain tissue per minute. MRP values are reported as relative (depicted as rCBV and rCBF) because MRP perfusion values are determined in comparison to that in the contralateral normal white matter. Permeability surface area product (PS) and the transfer constant (Ktrans) estimate the leakiness of the blood brain barrier, by measuring diffusion of contrast from the intravascular to the interstitial space [4]. Both parameters should be close to zero in normal brain. Ktrans can also be measured with MRP, however, there is inherent error in permeability measurements with MRI due to extravasation of gadolinium, altering the T1 and T2* signal dynamics [3]. K2 permeability values are corrected using a statistical model which account for T1 and T2* leakage effects.
CTP is often used in patients with contraindications to MRP. However, little is known about the comparability of perfusion parameters between the two modalities for the evaluation of brain tumors. A direct comparison of CTP with MRP has not been well studied in the same subset of patients with intracranial tumors. The purpose of our study was to directly compare CTP and MRP perfusion parameters in patients with intracranial tumors. It was hypothesized that perfusion parameters obtained from CTP would correlate with those obtained from MRP.
2. Methods
The study was approved by our institutional research ethics board (study number 1018631). CTP and MRP performed in patients with intracranial tumors in a prospective study were retrospectively analysed.
Patient selection- Consecutive patients presenting to our institution with a diagnosed brain tumor were approached to participate in our study. Individuals who provided informed consent and had both CTP and MRP performed within 7 days of each other were eligible for the study. In all cases, MRP was obtained first followed by CTP. The acceptable timeframe between the two imaging modalities was limited to 7 days to reduce the chances of tumor progression. Patients with a contraindication to imaging by MR or CT were excluded.
Imaging Technique- CT Perfusion - All patients underwent a 9.6-cm-coverage brain CTP protocol (80 kV, 100 mAs, 128 x 0.6 mm collimation, 9.6-cm scan volume in the z-axis by using an adaptive spiral scanning technique ["shuttle mode"], CT dose index of 122.64 mGy), with 18 scans every 1.67 seconds, 5 scans every 3 seconds and 4 scans every 15 seconds, resulting in a total scanning time of 100.06 seconds on the 128-section dual-energy CT scanner (Sensation Definition; Siemens Healthcare, Erlangen, Germany). A total of 40 ml of nonionic iodinated contrast media (iopamidol, Isovue-370; Bracco Diagnostic, Vaughan, Ontario, Canada) was injected at a rate of 5 ml/s, followed by a saline flush of 40 ml sodium chloride at 5 ml/s and a start delay of 5 seconds. Axial images with a section thickness of 5 mm were reconstructed without overlap and sent to the Picture Archiving and Communication System (PACS). CTP was done as a part of the prospective research study.
MR Perfusion- Axial T2*-weighted imaging gradient echo (GE) EPI sequence with TR- 2000, TE-26, flip angle-5, Matrix-96x128, Nex-1, FOV-22, were acquired with a temporal resolution of 2 seconds during and after injection of 0.1 mmol/kg body weight or 0.2 ml/kg body weight of MultiHance (gadobenate dimeglumine; Bracco Imaging, Canada, Montreal, QC) at a rate of 5 ml/s. Imaging was performed on a 1.5T MRI system (Signa HDxt, GE Healthcare). The total time of acquisition was 1 minute and 20 seconds. The acquisition covered the whole head with 20, 5 mm thick slices and inter-slice spacing of 1.5 mm. MRP was performed as part of standard of care.
Image Analysis and Post Processing- Vendor-provided software- CTP analysis was performed first with the vendor-provided Neuro-VPCT software (Siemens Healthcare) based on the semiautomatic deconvolution “Tumor” algorithm. Motion correction and bone segmentation was performed automatically; automatic arterial and venous vessel identification, vessel segmentation threshold, and depiction of a healthy hemisphere for normalization were done. The ROIs were determined by a radiology resident (KG) under the supervision of a fellowship trained neuroradiologist (JS). All ROIs were kept a consistent size, which was approximately 5 mm2. CBF and CBV value was obtained in four different ROIs: (1) whole tumor, (2) solid portion, (3) region of maximum perfusion (ROMP), and (4) contralateral normal white matter (Figure 1). MRP data were analyzed first using the vendor provided software package (Functool, GE Healthcare). The rCBV and rCBF values were obtained using four ROIs in approximately the same locations as the CTP analysis (whole tumor, solid portion, ROMP, and contralateral normal white matter) (Figure 1). Care was taken to avoid inclusion of large cerebrospinal fluid (CSF) space or large blood vessels in the ROIs.
Vendor-neutral software- Both CTP and MRP were also processed with an automated vendor-neutral software Oleasphere (Olea Medical Solutions Inc). CBF, CBV, and permeability values were obtained using the same four ROIs in approximately the same locations. Gray-scale and color-coded perfusion parameter maps were stored in a Digital Imaging and Communications in Medicine (DICOM) format.
CT and MR perfusion values were recorded as both absolute and normalized values (compared to the contralateral normal appearing white matter ROI). The MR vendor-provided software did not have the function to process permeability, therefore, comparison of permeability parameters were only performed from vendor-neutral software.
Statistics- Linear regression was used to compare the CTP and MRP parameters from both vendor-provided and vendor-neutral software and Pearson’s correlation coefficients were calculated. A p-value of < 0.05 was considered significant. STATA 13.0 software was used for statistical calculations.
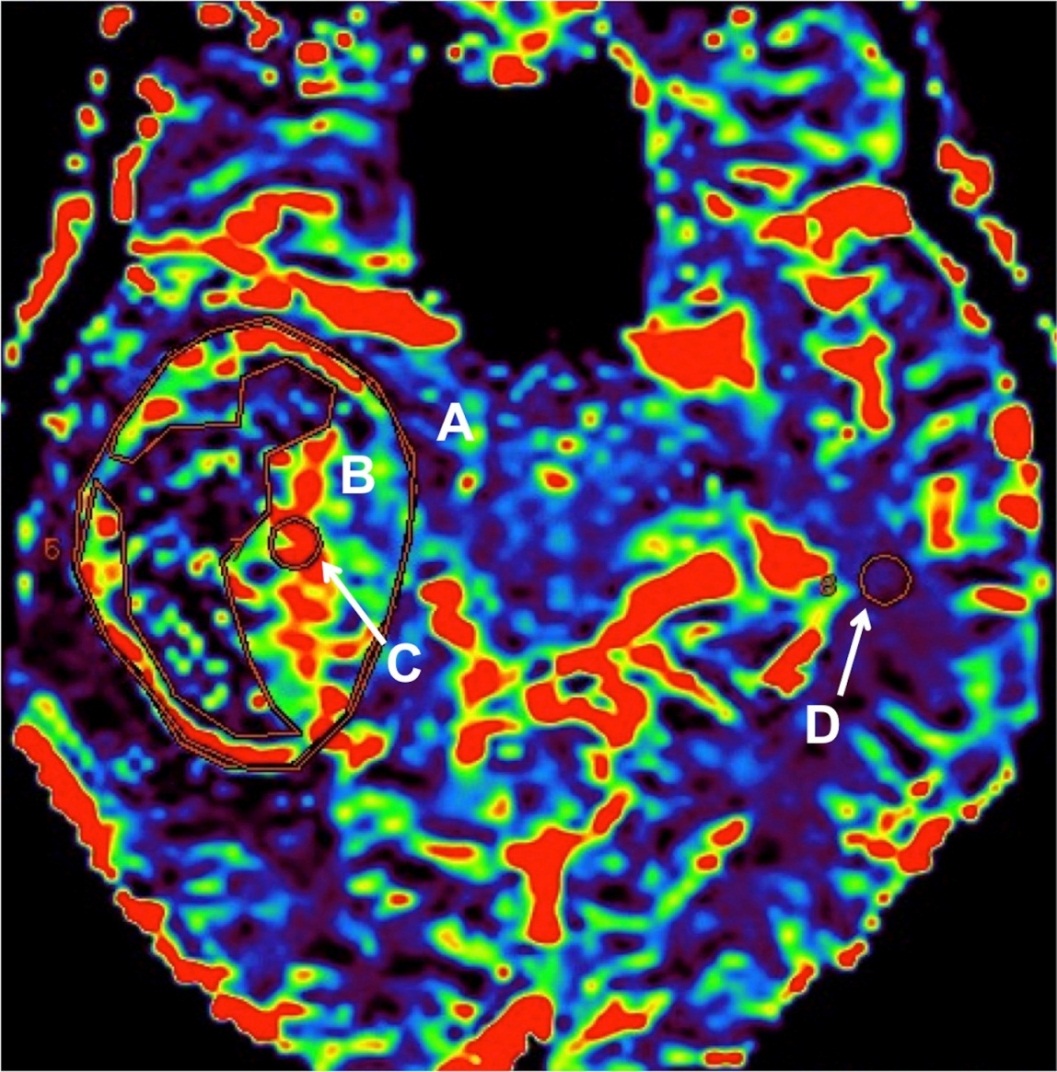
Figure 1 Region of interest (ROI) placement on a cerebral blood flow (CBV) map in a patient with a right temporal lobe brain tumor. A- whole tumor; B- solid portion; C- region of maximum perfusion (ROMP) and D- contralateral normal white matter.
3. Results
From March 2014 to March 2015, 21 patients (13 males; mean age: 65 years, range: 51-76 years) were newly diagnosed with brain tumors and underwent both CTP and MRP. The most common diagnosis was glioblastoma multiforme (17 patients), followed by metastasis (3) and grade 3 astrocytoma (1). Mean time interval between CTP and MRP was 6.8 hours (range: 1 - 49 hours).
MRP of one patient was excluded due to excessive motion artefact. Data from only 18 patients were analyzed on the vendor-provided software as 2 patients were excluded due to file corruption that prohibited post-processing. Overall, the absolute values obtained from MRP were smaller compared to that from CTP with vendor-provided software (Table 1). There was a strong positive correlation between absolute CBV values in the ROMP (r2 = 0.26, p = 0.031) and normalized CBF in the whole tumor (r2 = 0.34, p = 0.011). There was only a weak but significant positive correlation for normalized CBV (r2 = 0.29, p = 0.020). The ROMP absolute CBV value performed with CTP could be predicted from MRP value by the following equation, CT = 5.39 0.49 (MR). There was no significant linear relationship between CTP and MRP for the remainder of the perfusion parameters.
Table 1 Mean absolute and normalized (“n”) cerebral blood volume (CBV) and cerebral blood flow (CBF) CT and MR perfusion values with vender-provided software, and correlation.

Twenty patients were analyzed using the vendor-neutral software. The CBV and CBF values were similar between CTP and MRP, except MRP CBF values were overall larger than CTP (Table 2). There was a weak but significant positive correlation between normalized CBF values of the whole tumor (r2 = 0.38, p = 0.008) and solid component (r2 = 0.47, p = 0.002). There was no significant correlation between absolute CBF and CBV values. There was also no significant correlation between the permeability parameters from CT (Ktrans and PS) and MR (K2) (Table 3). Table 4 shows the correlation between the CBF and CBV computed from vendor provided and vendor neutral CT and MR perfusion. This showed significant correlation between CBV and CBF of whole tumor and CBV of solid component of the tumor on CT perfusion.
Table 2 Mean absolute and normalized (“n”) cerebral blood volume (CBV) and cerebral blood flow (CBF) CT and MR perfusion values with vender-neutral software, and correlation.
Table 3 Correlation of CT (Ktrans and PS) and MR (K2) permeability values obtained with vender-neutral software.
Table 4 Mean absolute and normalized (“n”) cerebral blood volume (CBV) and cerebral blood flow (CBF) computed from vendor provided and vendor neutral CT and MR perfusion values and correlation.
4. Discussion
Our study showed some significant correlations between CT and MR perfusion parameters for both vendor-provided as well as vendor-neutral software, although these were not consistent between different ROIs. A positive linear relationship was shown with absolute CBV values using a ROI in the ROMP and normalized CBF in the whole tumor. Permeability parameters did not show any correlation as these parameters (CT Ktrans and PS and MR K2) actually measure different phenomenon and cannot and in fact should not have been compared directly [5,6]. Only one other study has assessed the relationship between CTP and MRP perfusion values, in a small selected group of patients with high grade gliomas [7]. This study showed that normalized CBV in ROMP on both CTP and MRP had linear correlation. The MRP technique used in that study was a T2 weighted spin echo EPI sequence. This was different from the technique used in our study, which was a T2* gradient echo EPI sequence. No study has compared CTP to MRP values using a T2* gradient echo EPI technique.
While the use of MRI as an imaging modality has grown progressively in the medical management of brain tumors, its implementation remains contraindicated in several patient populations, such as individuals with cardiac pacemakers, implanted hearing aids, or neurostimulators [8]. In comparison to MRP, CTP also offers the advantages of lower costs, faster scans, and more accessibility [9]. CTP has been used extensively for the characterization of acute stroke and possesses promising application in tumor imaging [1,10,11,12,13], despite the risk of a small dose of ionizing radiation (2-3 mSv). The correlations shown in this study, although somewhat limited, could potentially increase the use of CTP in the investigation of brain tumors. However, more research is required to determine if modifications in imaging acquisition and post-processing techniques may lead to further equivalency between CTP and MRP methods. Despite being significant (p < 0.05) the correlation coefficient has remained weak to strong (r < 0.50). A possible explanation for the relatively poor correlation could be the differences in patient angulation, slice selection and spatial resolution between CT and MRI. A T2* gradient echo EPI sequence was used for MRP acquisition, rather than a spin echo EPI sequence as in the previous study. T2* gradient echo EPI is more sensitive to the T2* susceptibility effects from gadolinium and less sensitive to the masking effects of T1 [13,14], therefore, this technique may lead to changes in perfusion values compared to a spin echo EPI sequence.
Limitations- ROIs of the whole tumor or solid portion were difficult to reproduce with CT and MRI, especially with vendor-provided software, due to slight differences in slice selection, angulation and spatial resolution. The ROMP identified on MRP studies often showed no density (black) on CT perfusion maps with no perfusion value, possibly due to the threshold set up. Due to this, we had to put ROIs in the region adjacent to the ROMP and this might have resulted in less than optimal correlation between the values on CTP and MRP. Perfusion and permeability values for each region of interest were recorded only once rather than taking an average of multiple measurements. Multiple ROIs in the same region may more accurately reflect the true perfusion value, especially for the ROMP. Despite including consecutive presenting brain tumors, the study remains limited by a small sample size. A study with larger sample size may demonstrate better comparability between CTP and MRP for brain tumors.
In conclusion, significant positive correlations were seen for CBF and CBV values between CTP and MRP methods. CTP may potentially be used interchangeably with MRP, for imaging of brain tumors, especially when MRP is contraindicated.
Author Contributions
Kirsten Greenlaw-Collected the data, wrote the first draft and edited the manuscript. Jai Shankar- Original idea, data analysis, final manuscript editing and submission.
Competing Interests
The authors have declared that no competing interests exist.
References
- Jain R, Poisson LM, Gutman D, Scarpace L, Hwang SN, Holder CA, et al. Outcome prediction in patients with glioblastoma by using imaging, clinical, and genomic biomarkers: focus on the nonenhancing component of the tumor. Radiology. 2014; 272: 484-493. [CrossRef]
- Chavhan GB, Babyn PS, Thomas B, Shroff MM, Haacke EM. Principles, techniques, and applications of T2*-based MR imaging and its special applications. Radiographics. 2009; 29: 1433-1449. [CrossRef]
- Skinner JT, Moots PL, Ayers GD, Quarles CC. On the use of DSC-MRI for measuring vascular permeability. AJNR Am J Neuroradiol. 2016; 37: 80-87. [CrossRef]
- Shankar JJS, Woulfe J, Silva VD, Nguyen TB. Evaluation of perfusion CT in grading and prognostication of high-grade gliomas at diagnosis: A pilot study. AJR Am J Roentgenol. 2013; 200: W504-W509. [CrossRef]
- Cuenod CA, Balvay D. Perfusion and vascular permeability: basic concepts and measurement in DCE-CT and DCE-MRI. Diagn Interv Imaging. 2013; 94: 1187-1204. [CrossRef]
- Eilaghi A, Yeung T, d’Esterre C, Bauman G, Yartsev S, Easaw J, et al. Quantitative perfusion and permeability biomarkers in brain cancer from tomographic CT and MR images. Biomark Cancer. 2016; 8: 47-59. [CrossRef]
- De Simone M, Muccio CF, Pagnotta SM, Esposito G, Cianfoni A. Comparison between CT and MR in perfusion imaging assessment of high-grade gliomas. Radiol Med (Torino). 2013; 118: 140-151. [CrossRef]
- Dill T. Contraindications to magnetic resonance imaging: non-invasive imaging. Heart Br Card Soc. 2008; 94: 943-948. [CrossRef]
- Maarouf R, Sakr H. A potential role of CT perfusion parameters in grading of brain gliomas. Egypt J Radiol Nucl Med. 2015; 46: 1119-1128. [CrossRef]
- Griffith B, Jain R. Perfusion imaging in neuro-oncology: basic techniques and clinical applications. Radiol Clin North Am. 2015; 53: 497-511. [CrossRef]
- Narang J, Jain R, Scarpace L, Saksena S, Schultz LR, Rock JP, et al. Tumor vascular leakiness and blood volume estimates in oligodendrogliomas using perfusion CT: An analysis of perfusion parameters helping further characterize genetic subtypes as well as differentiate from astroglial tumors. J Neurooncol. 2011; 102: 287-293. [CrossRef]
- Jain R, Ellika S, Lehman NL, Scarpace L, Schultz LR, Rock JP, et al. Can permeability measurements add to blood volume measurements in differentiating tumefactive demyelinating lesions from high grade gliomas using perfusion CT?. J Neurooncol. 2010; 97: 383-388. [CrossRef]
- Jain R, Scarpace L, Ellika S, Schultz LR, Rock JP, Rosenblum ML, et al. First-pass perfusion computed tomography: Initial experience in differentiating recurrent brain tumors from radiation effects and radiation necrosis. Neurosurgery. 2007; 61: 778-786; discussion 786-787. [CrossRef]
- Sugahara T, Korogi Y, Kochi M, Ushio Y, Takahashi M. Perfusion-sensitive MR imaging of gliomas: Comparison between gradient-echo and spin-echo echo-planar imaging techniques. AJNR Am J Neuroradiol. 2001; 22: 1306-1315.